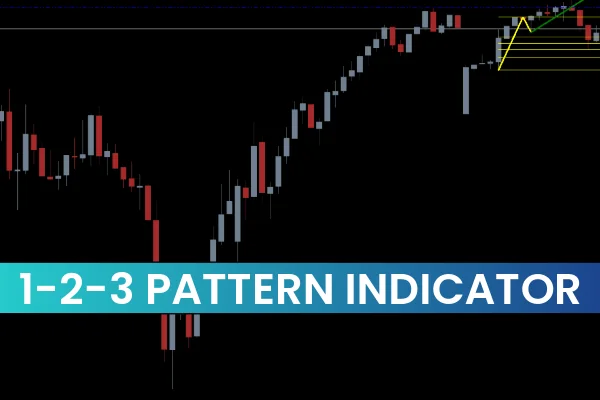
The 1-2-3 Pattern Indicator for MT4 is a powerful tool for traders who rely on Price Action strategies. This indicator identifies trend reversals by plotting a zig-zag pattern with three key points—High/Low, Entry, and Fibonacci (Fib) levels. By combining these points with Fibonacci retracement levels, traders can detect critical Support And Resistance zones and make more informed trading decisions.
Understanding the 1-2-3 Pattern Indicator
The 1-2-3 pattern is a simple yet effective price action concept. It identifies the end of a trend and signals potential reversals. The indicator plots a non-repainting zig-zag line connecting the three points:
Point 1: High/Low of the current trend
Point 2: Entry point for the potential reversal
Point 3: Confirmation point for the trend change
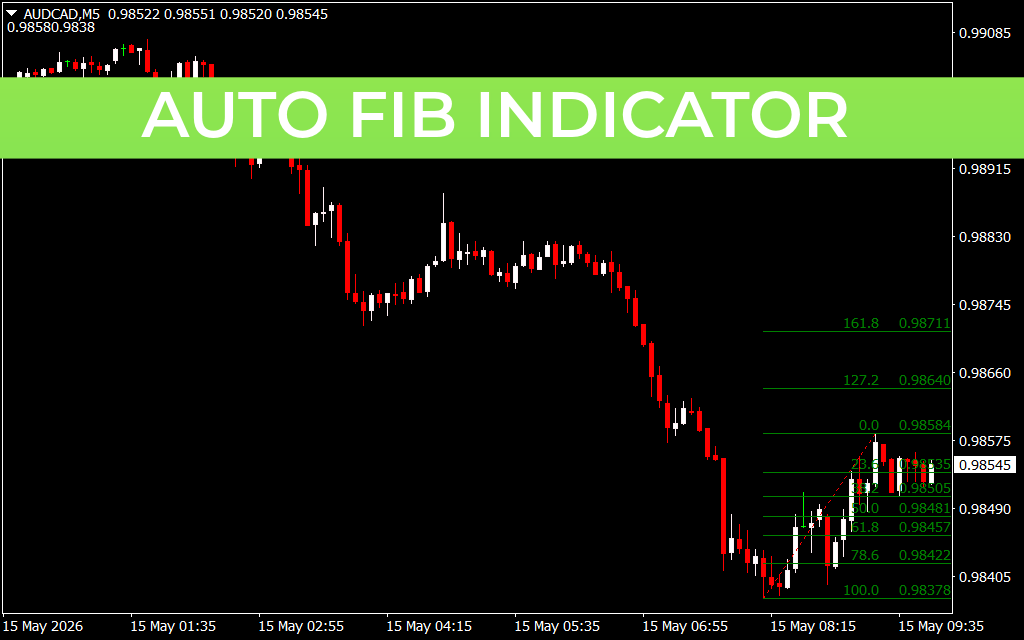
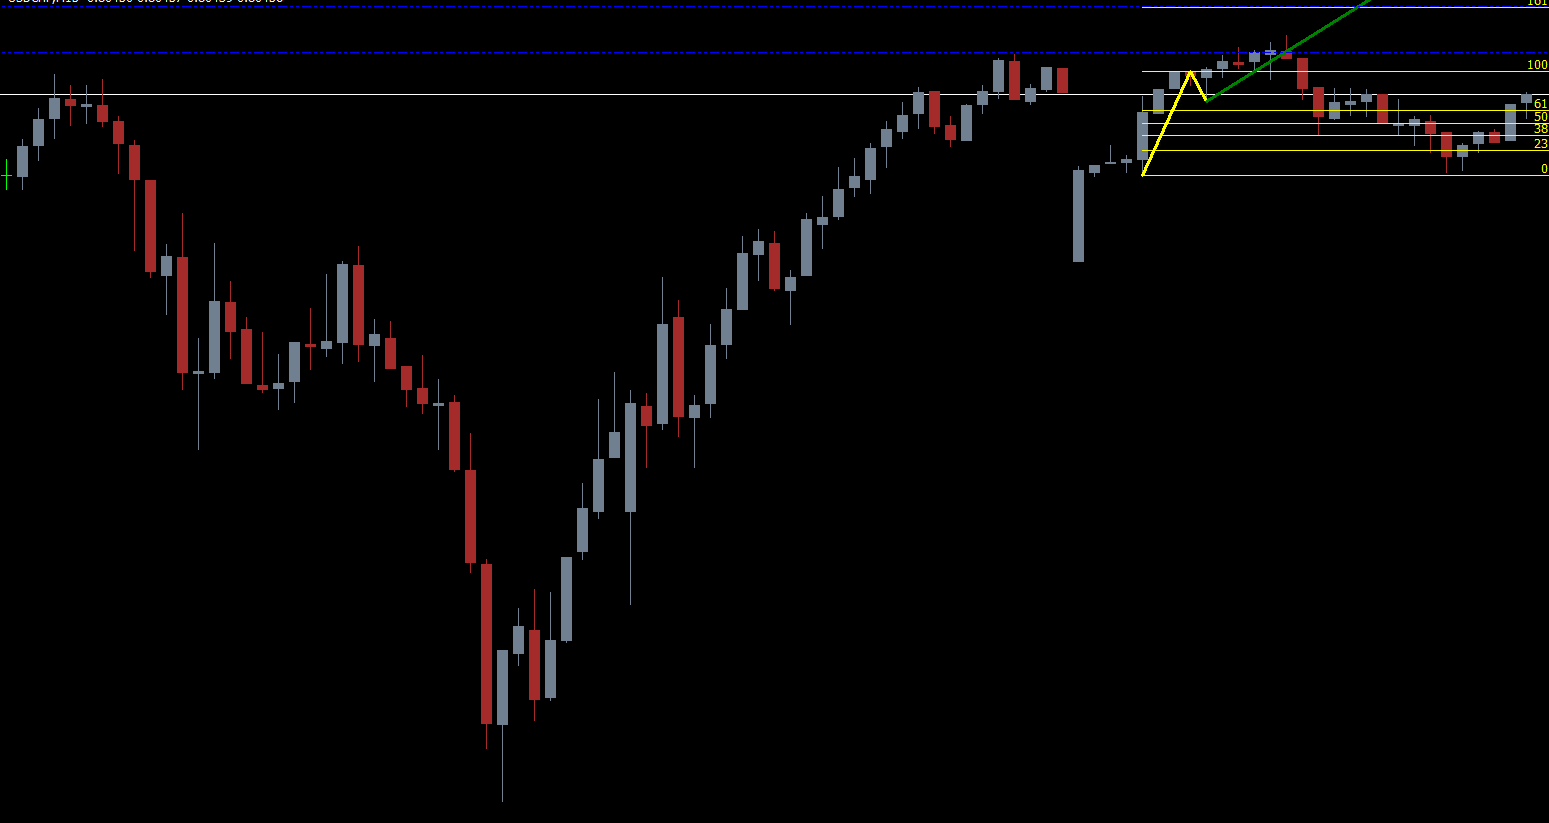
In addition, the indicator highlights five Fibonacci levels, which act as support and resistance zones. These levels help traders place stop-losses and take-profit orders more effectively.
The indicator works on all timeframes, but it is most effective on short-term charts, such as 5-minute to 30-minute charts.
How to Trade Using the 1-2-3 Pattern Indicator
The 1-2-3 Pattern Indicator provides clear signals for both buy and sell trades. The zig-zag lines and Fibonacci levels give traders precise entry and exit points.
Buy Setup
Ensure the indicator suggests an uptrend (green line).
Wait for the trend to fully develop.
Enter the trade at the beginning of the indicator signal.
Place a stop-loss near the low of the buying point.
Exit the trade if the price dips below the indicator line or the trend changes color.
Sell Setup
Ensure the indicator suggests a downtrend (blue line).
Wait for the trend to fully develop.
Enter the trade at the start of the indicator signal.
Place a stop-loss near the high of the selling point.
Exit the trade if the price moves above the indicator line or the trend changes color.
Benefits of the 1-2-3 Pattern Indicator
Accurate Entry and Exit Points: Helps traders pinpoint the beginning and end of trends.
Support and Resistance Levels: Fibonacci levels guide stop-loss and take-profit placement.
Non-Repainting Zig-Zag Lines: Provides reliable signals that remain consistent.
Price Action Focused: Ideal for traders using Trend Reversal strategies.
Timeframe Flexibility: Can be applied to short-term and long-term charts.
By visually combining zig-zag points and Fibonacci levels, the indicator reduces the guesswork and helps traders execute trades with confidence.
Conclusion
The 1-2-3 Pattern Indicator for MT4 is an essential tool for traders focused on price action and trend reversals. By plotting three key points along with Fibonacci levels, it highlights potential support and resistance zones and provides accurate entry and exit points. Whether you are a beginner or an experienced trader, this indicator can help improve trading accuracy and confidence.
For more free MT4 indicators and trading tools, visit IndicatorForest.com to expand your trading strategy and enhance market analysis.
FAQ
5 Downloads
Published:
Dec 02, 2025 00:11 AM
Category: