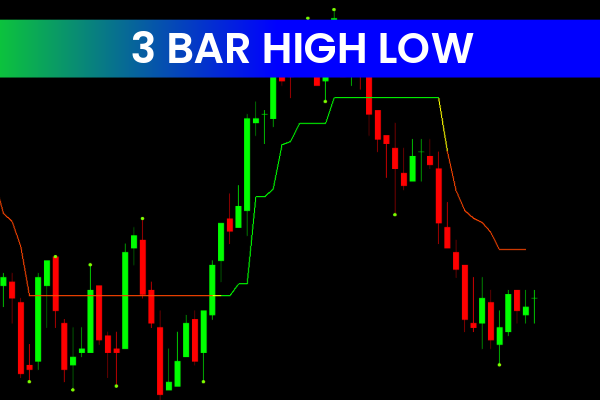
3 Bars High Low Indicator
The 3 Bars High Low Indicator for MetaTrader 4 (MT4) is a trend and market-structure analysis tool that evaluates the highs and lows of the last three consecutive candlesticks to determine whether the market is bullish, bearish, or ranging.
By combining Average True Range (ATR), Commodity Channel Index (CCI), and fractal analysis, the indicator plots a dynamic trend line directly on the price chart and highlights key support and resistance zones for potential trade entries, exits, and stop-loss placement.
How the 3 Bars High Low Indicator Works
The indicator continuously analyzes the sequence of the most recent three candles:
If Price Action shows bullish dominance, the indicator confirms an uptrend
If sellers control the market, a downtrend is detected
When neither side dominates, the market is considered ranging
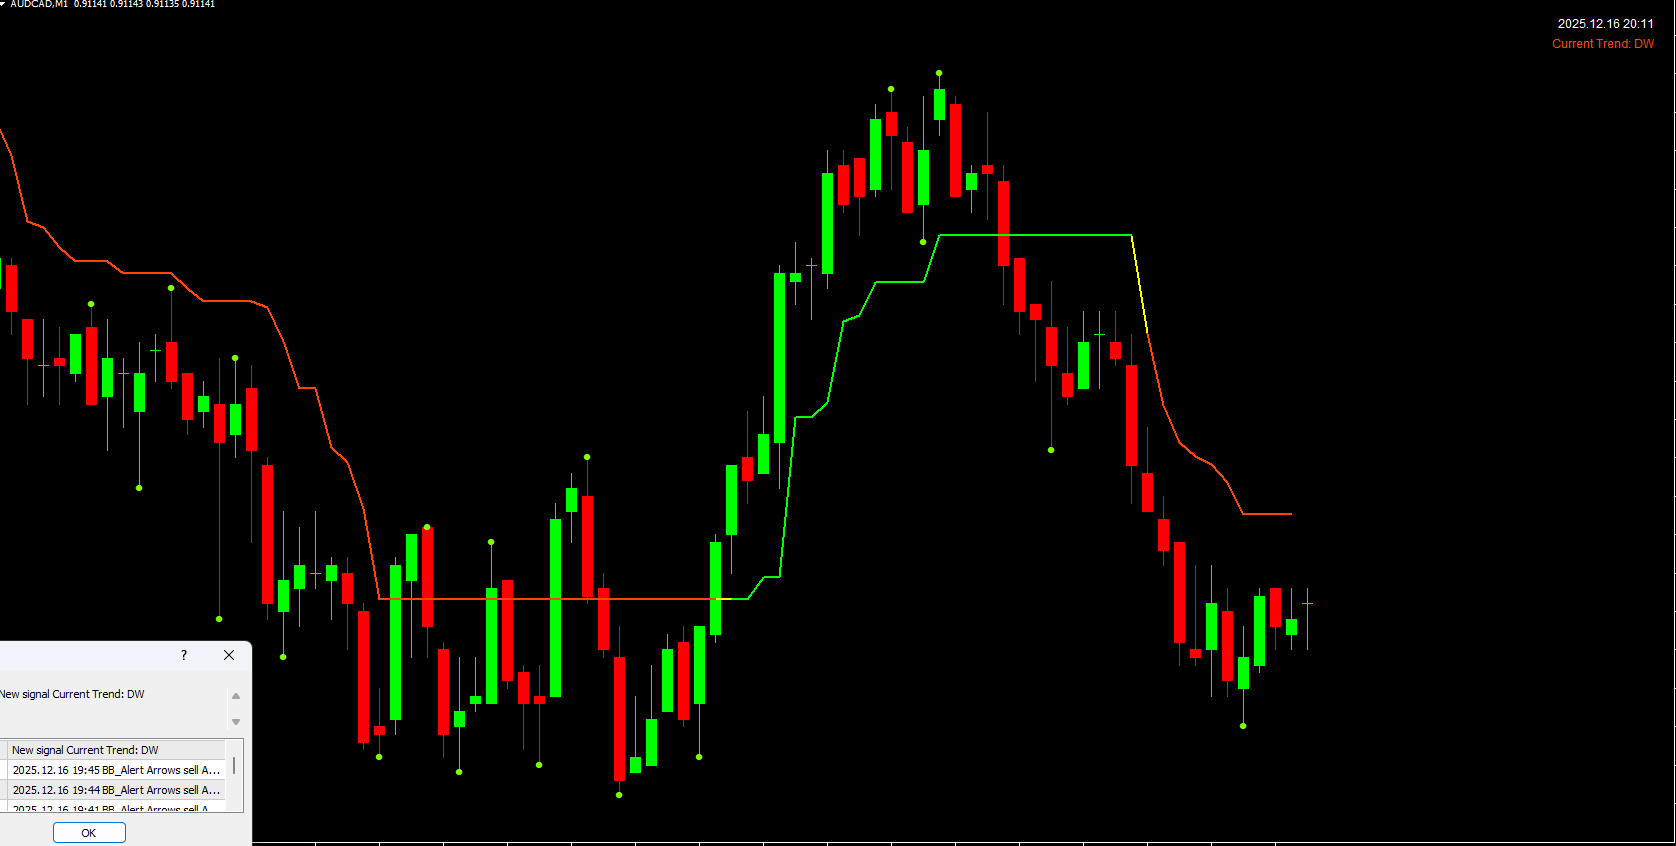
A dynamic line is plotted on the chart and changes color based on market direction:
LIME → Uptrend
Orange-RED → Downtrend
In addition, the indicator plots fractal dots, which act as potential reversal or breakout zones.
Fractal Zones Explained
The plotted dots represent fractal zones, which are critical areas of interest for traders:
Act as Support And Resistance levels
Highlight possible trend continuation zones
Signal potential trend reversals
Ideal areas for Stop Loss placement
A trader may look for:
Buy opportunities when price breaks above a fractal in an uptrend
Sell opportunities when price breaks below a fractal in a downtrend
These zones provide structure to price action and help traders avoid random entries.
Trading Applications
The 3 Bars High Low Indicator can be used in multiple ways:
Trend-following strategies
Breakout trading
Reversal trading near key fractal levels
Trade management and stop-loss optimization
For example:
A trader may consider a buy trade when the trend line turns LIME and price breaks above a fractal
A sell trade may be considered when the line turns Orange-RED and price breaks below a fractal
For best results, the indicator should be combined with price action, support and resistance analysis, or other confirmation indicators.
Features of the 3 Bars High Low Indicator
Combines 3-bar high-low logic, ATR, CCI, and fractals
Displays a dynamic trend line on the price chart
Identifies bullish, bearish, and ranging markets
Highlights support and resistance zones
Works on all MT4 timeframes
Includes alert notifications (screen and email)
Suitable for Scalping, day trading, and swing trading
Benefits of Using the Indicator
Support and Resistance Identification
The fractal zones and high-low levels act as natural support and resistance areas.
Reliable Trend Confirmation
The dynamic line color helps traders instantly identify the prevailing market trend.
Better Trade Entries and Exits
The indicator assists traders in spotting optimal entry points, exit levels, and stop-loss zones.
Reduced Market Noise
By filtering price action through multiple technical components, the indicator provides clearer signals.
Who Should Use the 3 Bars High Low Indicator
This indicator is ideal for:
Forex trend traders
Breakout traders
Price action traders
Intraday and swing traders
MT4 users seeking structured market analysis
It is suitable for both beginner and experienced traders, especially when used alongside other technical tools.
Final Thoughts
The 3 Bars High Low Indicator for MT4 is a powerful market-structure and trend analysis tool that blends multiple technical concepts into one clear visual system. By identifying trend direction, support and resistance levels, and fractal breakout zones, it helps traders make more objective and disciplined trading decisions.
When combined with proper risk management and confirmation tools, this indicator can significantly enhance trading accuracy and confidence.
FAQ
3 Bars High Low identifies patterns where three consecutive bars form significant highs or lows. These patterns often signal potential reversals or continuation of trends.
When three bars form a pattern with the middle bar being the highest (three-bar high) or lowest (three-bar low), it often signals a potential reversal. These patterns indicate exhaustion at extremes.
Enter reversal trades when 3-bar patterns complete, use patterns for stop-loss placement beyond the pattern extreme, target the opposite side of the range, and wait for pattern confirmation before entering.
Pattern recognition identifies high-probability reversal zones, provides clear entry and exit points, offers objective trading signals, and helps traders spot opportunities that might be missed otherwise.
Combine with trend indicators to avoid counter-trend trades, use with momentum oscillators for confirmation, integrate with support/resistance levels, and combine with volume analysis to validate patterns.
8 Downloads
Published:
Dec 16, 2025 14:14 PM
Category: