Master Trend Directions with the 4 MAs Trend Indicator
Trading in alignment with the institutional trend is the foundational cornerstone of profitable technical analysis. However, retail traders frequently struggle with market noise, getting chopped up during ranging markets or entering a trend right as it reaches major exhaustion zones. Relying on a single moving average often results in late entries or premature exits during temporary pullbacks. For intraday traders managing liquid assets like the EUR/USD pair, combining multiple layers of trend data is essential. The 4 MAs Trend Indicator provides a definitive, multi-layered solution by condensing a complex moving average matrix into a highly intuitive visual system.
What is the 4 MAs Trend Indicator?
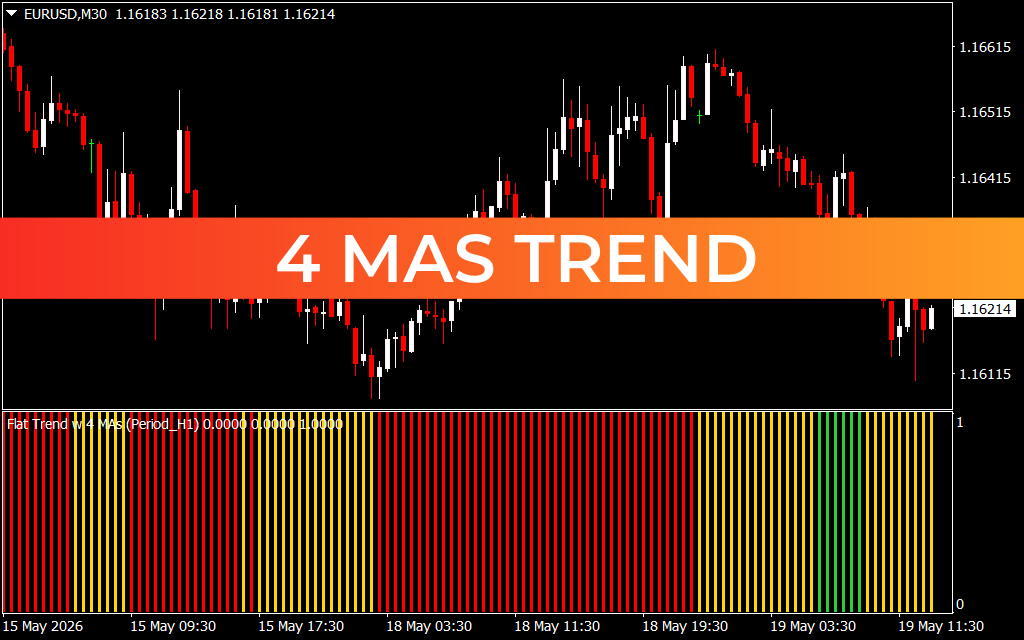
The 4 MAs Trend indicator is an advanced mathematical trend-following software built for multi-asset trading platforms like MetaTrader. Instead of forcing you to decipher four different moving average lines overlapping and cluttering your main candlestick charts, this indicator runs calculations in the background and translates the data into a clean sub-window dashboard.
The core algorithm coordinates four unique moving average tracks simultaneously, typically blending short-term, medium-term, and long-term periods (such as the 10, 20, 50, and 200 baselines). By tracking the exact geometric alignment, crossover status, and slope of these four distinct lines, the indicator computes a real-time consensus of macro market direction.
Clean Structural Features and Technical Advantages
- Visual Matrix Panel: The indicator replaces messy on-chart lines with a clean, continuous barcode-style histogram in a dedicated lower panel.
- Triple Color Coding System: The vertical bars change colors instantly to reflect shifting market dynamics:
- Bright Green: Confirms absolute bullish alignment, indicating that all four moving averages are stacked sequentially upward.
- Deep Red: Confirms absolute bearish alignment, signaling aggressive downward institutional sell pressure.
- Yellow: Indicates a transitional phase, market consolidation, or an active counter-trend corrective pullback.
- Intraday Support Integration: As displayed on mid-tier intervals like the 30-minute (M30) chart, it enables scalpers and day traders to identify localized ranges and high-velocity trend breakouts at a glance.
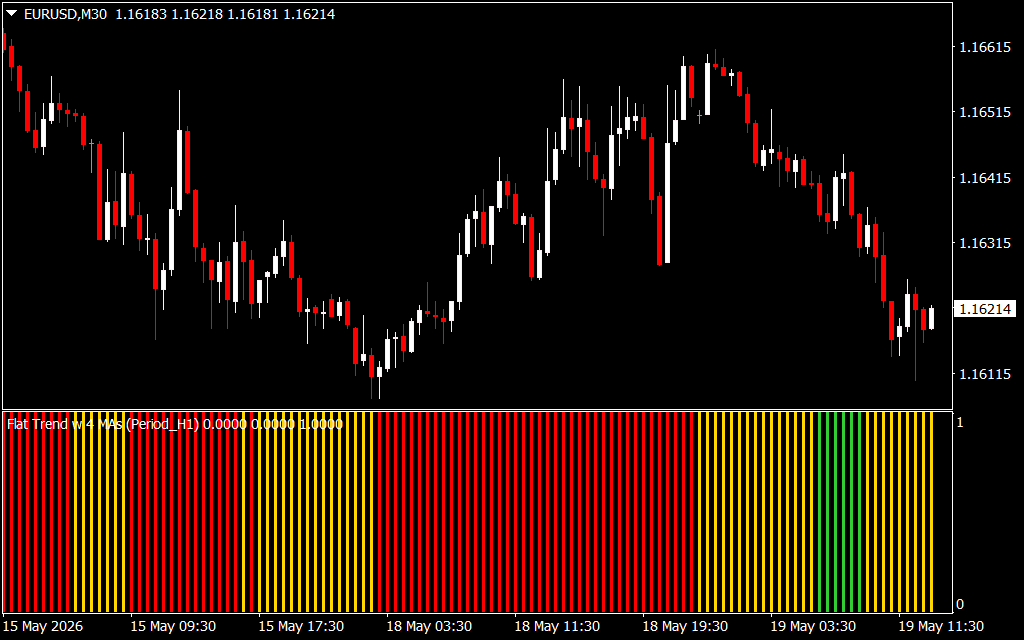
- Uncluttered Workspace Layout: Keeping the primary interface completely free of lines allows you to focus clearly on manual chart structures, key Support And Resistance zones, or price action candlestick patterns.
How to Trade with the 4 MAs Trend Indicator
Maximizing this tool requires using the transitional zones to prepare for explosive trend continuations.
- Capturing Bearish continuations: When the broader Market Structure is descending and the indicator panel turns a deep, solid red, the market is highly stable for shorting. If price pulls back slightly and the bars turn yellow, wait patiently. The moment the panel flips decisively back to red, execute a short entry to capture the next downward impulse leg.
- Trading Bullish Breakouts: Watch for consolidated, sideways Price Action where the indicator switches rapidly between yellow and red. Once a strong green bar prints, it reveals that all four averages have aligned upward, confirming a powerful bullish breakout.
Upgrade your chart setups today by downloading the 4 MAs Trend indicator to trade with true institutional confluence.
1 Download
Last Update:
May 19, 2026 16:44 PM
Published:
Jan 19, 2026 17:48 PM
Category: