The 4 Period MA W Regr Std Indicator for MT4 is a powerful technical analysis tool designed to automatically detect Support And Resistance zones, trend channels, and volatility patterns using multiple moving averages and regression calculations. This indicator is suitable for both beginner and advanced traders, offering a clean and systematic approach to identifying high-probability trading opportunities.
By combining four moving averages, a regression channel, and a standard deviation channel, the indicator helps traders visualize Market Structure in a simplified way. Whether you're scalping, day trading, or swing trading, this tool works efficiently across all chart timeframes—including M1, H1, and monthly charts.
How the 4 Period MA W Regr Std Indicator Works
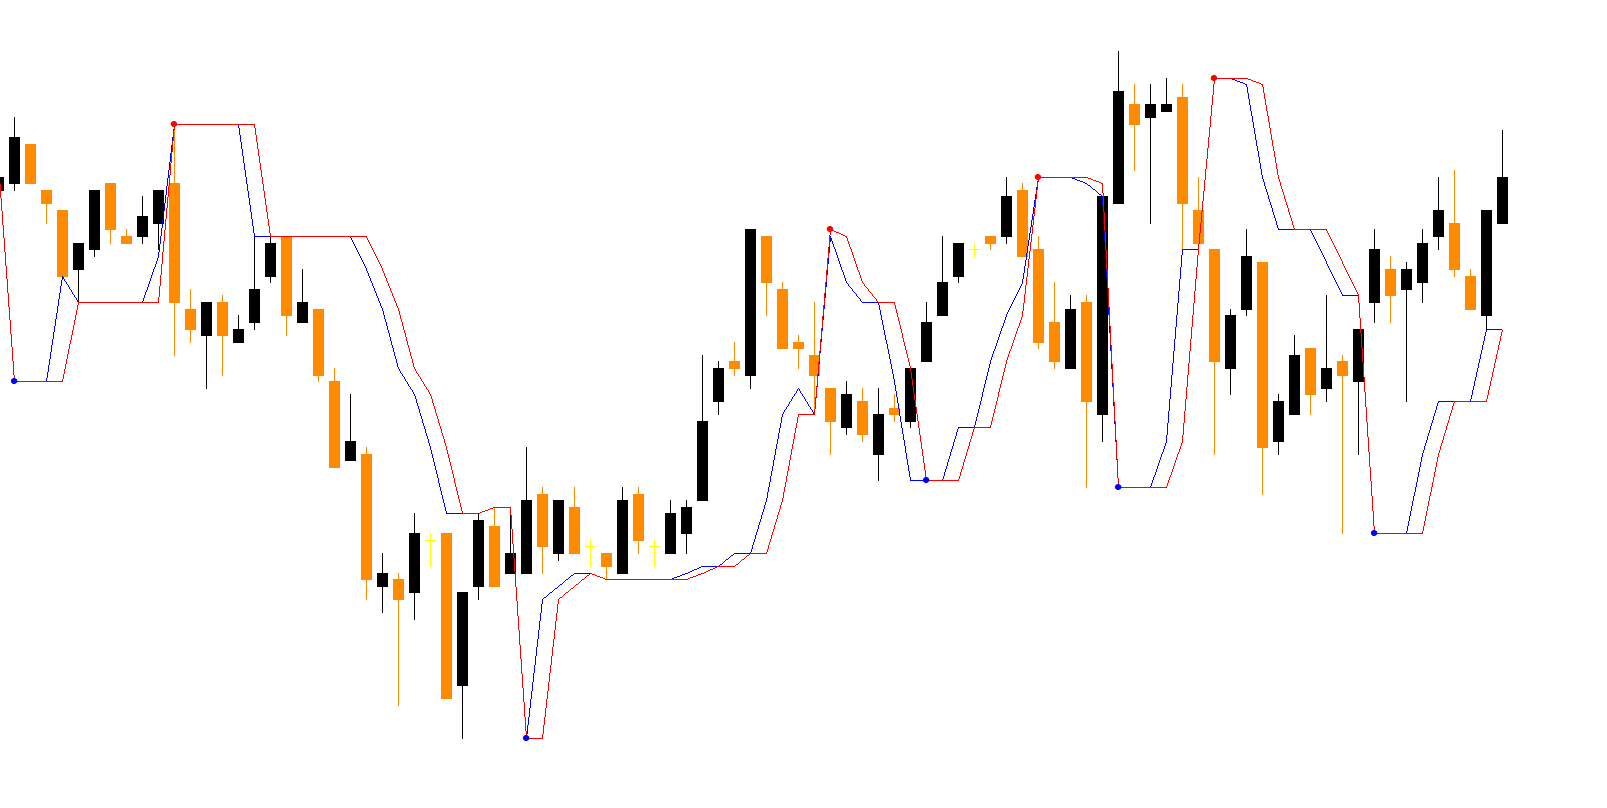
This indicator uses four moving averages: 5-minute, 15-minute, 60-minute, and 240-minute structures to plot dynamic support and resistance blocks on the chart. These appear as clearly marked green and red rectangles, helping traders locate reaction points where price is likely to bounce or reverse.
Alongside these zones, the indicator also plots:
Regression Channel (Blue)
Standard Deviation Channel (Olive Color)
The regression channel helps determine the overall market direction by analyzing price slope. The standard deviation channel highlights volatility and helps traders anticipate breakouts and reversals with better accuracy.
This combination makes the indicator a complete market map for trend, structure, and volatility.
Trading Signals with the 4 Period MA W Regr Std Indicator
Buy Strategy
A potential buy setup forms when:
The regression channel slopes upward
Price tests the lower boundary of the regression or deviation channel
Price reacts from green support rectangles
A protective stop loss may be set below the previous swing low or below the lower channel line. A common take-profit method is targeting the upper side of the channel or the nearest resistance rectangle.
Sell Strategy
A short position becomes valid when:
The regression channel points downward
Price touches the upper boundary of the regression or standard deviation channel
Red resistance rectangles confirm price rejection
The logical target would be the opposite side of the channel or the next support zone.
Best Practices When Using the Indicator
To maximize accuracy, traders should consider:
Avoid trading against the channel direction
Combine signals with candlestick patterns (pin bars, engulfing candles)
Check higher timeframe direction for confirmation before entering lower timeframe trades
Use volume or momentum indicators for confluence
This indicator works well with tools such as RSI, MACD, and supply-demand frameworks when building a complete strategy.
Why Traders Prefer the 4 Period MA W Regr Std Indicator
Some of the main benefits include:
Automatic support and resistance detection
Adaptive to all market conditions
Works on Forex, indices, crypto, gold, and stocks
Ideal for beginner and advanced traders
Clear high-probability entry and exit zones
Its multi-layer structural approach makes it highly effective for trend identification, breakout detection, and swing trading.
Conclusion
The 4 Period MA W Regr Std Indicator for MT4 is a complete technical toolkit that helps traders identify support and resistance, regression channels, trend direction, and volatility. With its automatic plotting and visual clarity, it becomes a valuable asset for anyone seeking structured, confident decision-making.
👉 Download the indicator now at IndicatorForest.com and improve your chart analysis with advanced yet easy-to-use Forex tools.
FAQ
Last Update:
Dec 09, 2025 03:28 AM
Published:
Dec 09, 2025 03:27 AM
Category: