Maximizing Swing Momentum: The 4H Macd Fx Strategy Indicator
In financial trading, selecting the right execution timeframe is just as vital as choosing the correct technical indicators. While lower-timeframe charts like the 1-minute or 5-minute views attract day traders looking for fast action, they are highly susceptible to market noise, algorithmic sweeps, and false breakouts. For professional swing traders, the 4-hour ($4H$) timeframe offers an optimal balance, providing a clear window into broader institutional trends. The 4H Macd Fx Strategy Indicator automates your macro analysis by filtering structural data and delivering clear, rule-based entry triggers right on your workspace.
Here is an analytical look at how this strategy layout functions and how to use its signals to catch major swing expansions.
The Structural Edge of the 4-Hour Timeframe
The 4-hour chart provides a reliable foundation because its candlesticks encapsulate an entire half-session of global bank liquidity. Movements on this timeframe are driven by institutional capital flows rather than localized retail churn.
By anchoring the classic Moving Average Convergence Divergence ($MACD$) framework to this higher interval, the indicator evaluates macro momentum shifts. It computes the mathematical relationships between exponential moving averages, verifying when an asset has transitioned from an active distribution phase to a fresh institutional accumulation cycle. This high-period filtering ensures you only enter trades when the underlying market velocity has shifted on a macro scale.
Analyzing the Strategy Levels and Execution Filters
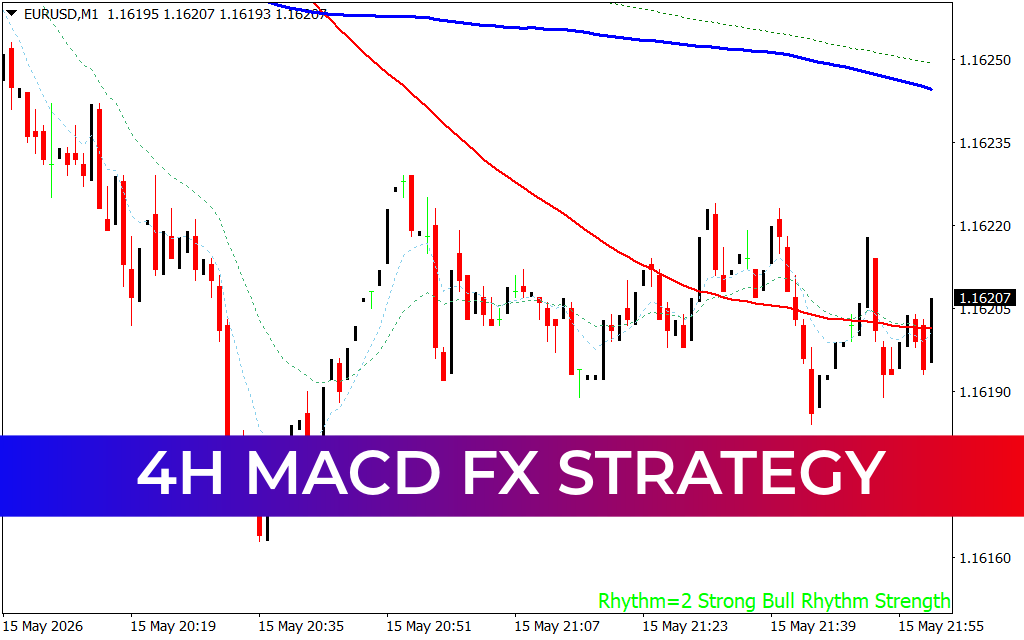
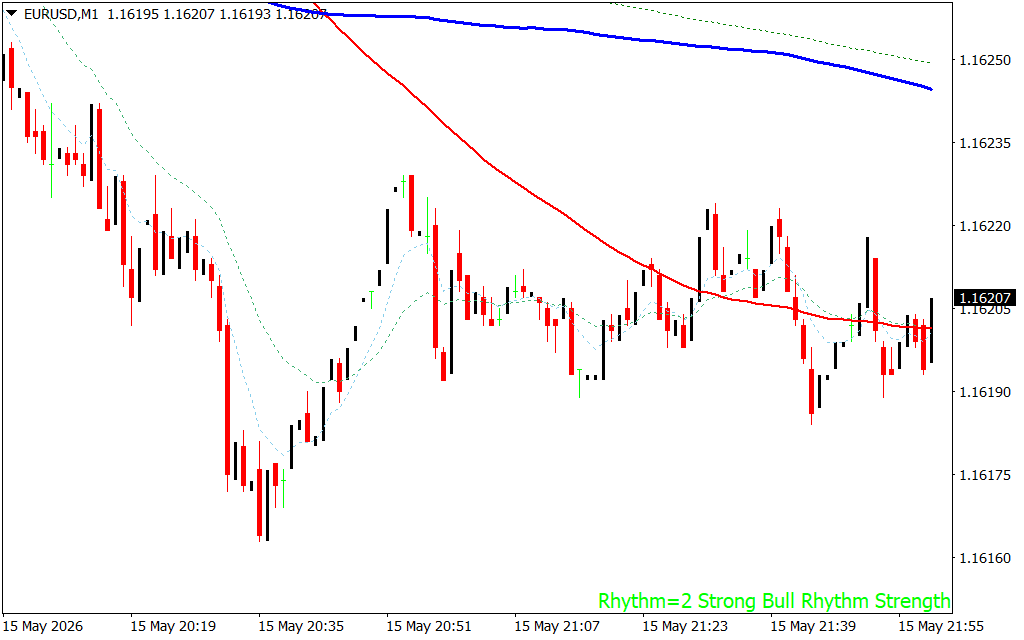
As demonstrated on the EUR/USD H1 chart (configured to display macro structural components), the indicator replaces standard line clutter with clean, horizontal channel boundaries and intuitive validation plots:
- The Upper Structural Baseline (Solid Red Line): The indicator continuously maps the primary institutional resistance ceilings. When the market rallies and forms a distribution plateau, this ceiling acts as an objective zone to look for short entries or set trailing profit targets.
- The Lower Demand Floor (Solid Green Line): Conversely, major accumulation zones are extended as solid green support baselines. This floor helps traders identify strong historical demand pockets where buyers are stepping in to defend the asset.
- The Confirmation Nodes (Green and Red Dots): To refine trade execution, the indicator plots colored entry nodes. Green dots signify localized momentum shifts favoring the bulls at key structural turning points, while red dots mark areas where short-term selling velocity has taken control within the broader macro channel.
Technical Guidelines for Position Management
To maximize the mathematical edge provided by the 4H Macd Fx Strategy indicator on your trading terminal, implement these active management rules:
- Strategic Channel Reversals: Focus your entry setups when the indicator's validation nodes line up with its horizontal boundaries. A green dot printing near the solid green support line carries a much higher structural win rate than a signal generated in mid-range noise.
- Objective Trailing Exit Models: When riding a multi-day swing trend, use the opposite structural boundary as your primary target. If you execute a long trade off the green floor, hold the position until price tests the red resistance line or until a trailing exit is triggered.
- Strict Risk Parameter Settings: Position your defensive stop-loss orders just a few pips beyond the physical green support baseline (for longs) or the red resistance baseline (for shorts). If a candle breaks completely past these levels, the structural trend thesis is officially invalidated.
3 Downloads
Last Update:
May 17, 2026 02:30 AM
Published:
Jan 20, 2026 22:30 PM
Category: