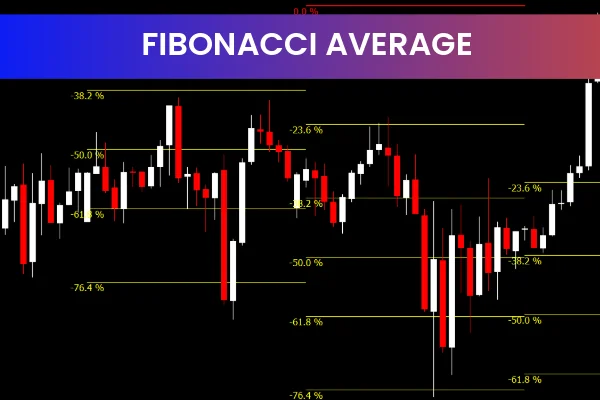
The Fibonacci Average Indicator is a popular and free MT4 Forex indicator that leverages the Fibonacci sequence to help traders identify key Support And Resistance levels. By calculating the average of a set number of previous bars based on Fibonacci numbers, this indicator provides a clear visual representation of potential market turning points.
This tool is ideal for traders looking for a simple yet effective method to spot entry and exit opportunities, as well as trend direction. Its automated calculations save time and reduce errors in manual analysis, making it suitable for both beginners and experienced traders.
What Is the Fibonacci Average Indicator
The Fibonacci Average Indicator uses the Fibonacci sequence—a series of numbers where each number is the sum of the two preceding numbers—to calculate moving averages on Forex charts. By applying Fibonacci numbers to determine the period for averaging, the indicator highlights levels where price is likely to find support or resistance.
Unlike standard moving averages, the Fibonacci Average provides a dynamic method of determining market levels, which can lead to better timing for trades.
How the Fibonacci Average Indicator Works
The indicator calculates the average price of a specified number of previous bars, using Fibonacci numbers as the period for calculation.
Key Features
Support and Resistance Identification: The plotted Fibonacci averages often align with natural price levels where reversals or consolidations occur.
Dynamic Averages: By adjusting the number of bars in the Fibonacci sequence, traders can adapt the indicator to short-term or long-term charts.
Entry and Exit Points: The indicator can help identify ideal trade setups by showing where price is likely to react.
Traders simply set the number of bars for the calculation, and the indicator automatically plots the average on the chart, making it easy to spot crucial price levels.
Benefits of Using the Fibonacci Average Indicator
The Fibonacci Average Indicator provides multiple advantages for Forex traders:
Automatically calculates averages based on Fibonacci numbers
Highlights potential support and resistance levels
Helps identify trend direction
Easy to apply to any chart or timeframe
Provides potential entry and exit points
Free and widely used among Forex traders
These features make it a versatile tool that can complement other technical indicators for more accurate trading decisions.
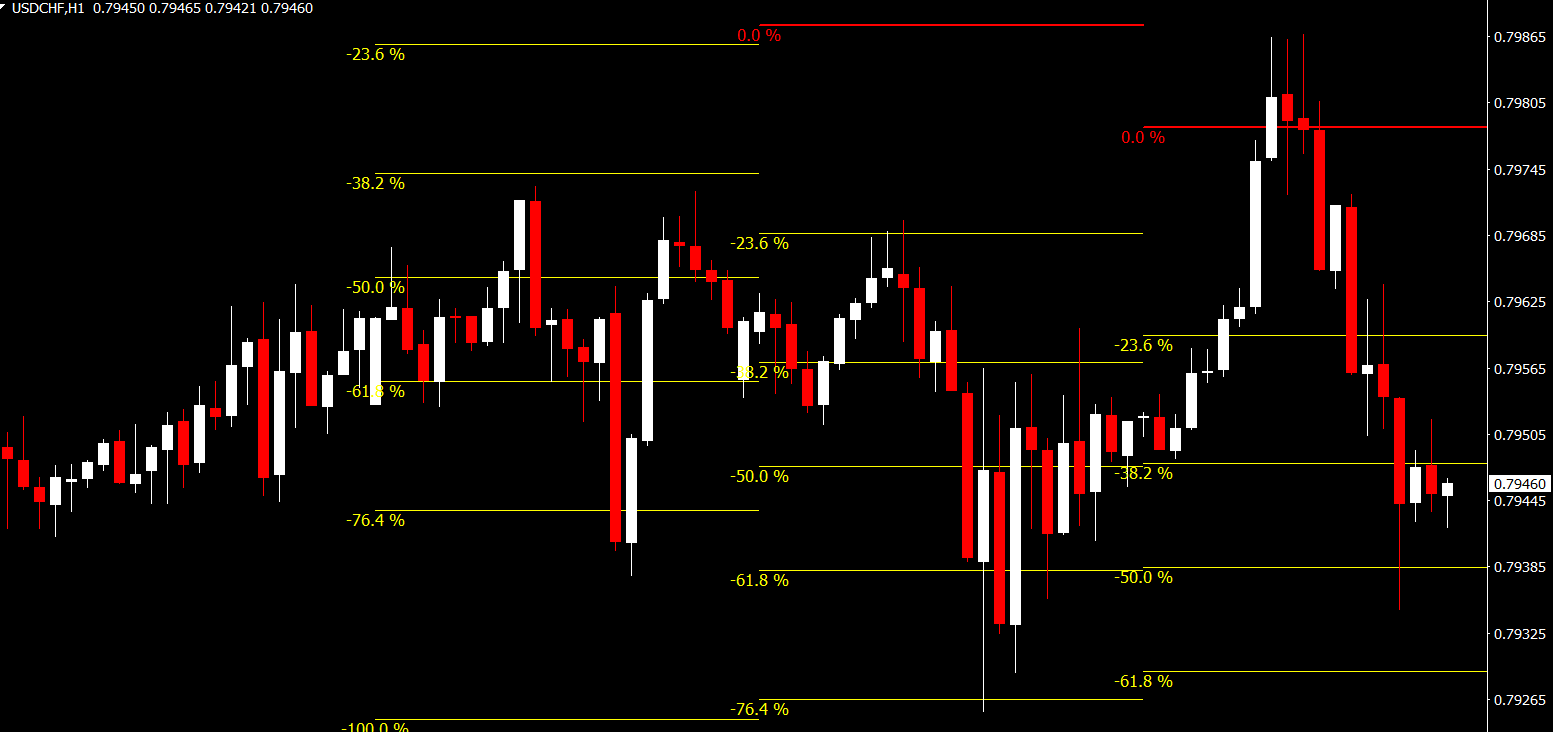
Identifying Support and Resistance Levels
Support and resistance levels are critical for understanding market behavior. The Fibonacci Average Indicator plots levels where price is likely to pause, reverse, or continue a trend.
Support: Levels below the current price where buying interest may appear
Resistance: Levels above the current price where selling interest may occur
Using these levels, traders can plan stop-loss placements, entry points, and profit targets.
Using the Indicator for Entry and Exit Points
The Fibonacci Average Indicator helps traders spot high-probability trade setups:
Buy Opportunities: When price approaches a Fibonacci average from above and bounces upward
Sell Opportunities: When price approaches a Fibonacci average from below and reverses downward
Trend Confirmation: Price consistently staying above or below the average can indicate the strength of a trend
Combining the indicator with other tools like RSI, MACD, or trend lines can enhance trade accuracy.
Best Timeframes and Market Conditions
The Fibonacci Average Indicator is suitable for all timeframes:
Short-term trading: M5 to H1 charts for intraday setups
Swing trading: H4 to daily charts for larger trends
Long-term trading: Weekly charts for position trades
It works best in trending markets, where price reacts to key support and resistance levels.
Advantages of the Fibonacci Average Indicator
Easy to install and use on MT4
Dynamic and adaptable to different timeframes
Supports trend identification and trade planning
Provides clear visual cues for support and resistance
Free to download and widely trusted among traders
This combination of simplicity and efficiency makes it an essential tool for Forex analysis.
Final Thoughts
The Fibonacci Average Indicator is a reliable and free MT4 tool that helps traders identify key support and resistance levels, spot potential trade setups, and plan entry and exit points. By leveraging Fibonacci-based averages, it offers a unique approach to price analysis that enhances trading strategy.
For more free MT4 indicators and tools to improve your Forex trading, visit IndicatorForest.com and discover a range of indicators designed to maximize your trading performance.
FAQ
It applies Fibonacci‑based lookback periods to calculate dynamic averages that often align with natural support and resistance. This helps you see levels where price may pause or reverse.
You can look for buying opportunities when price pulls back to a Fibonacci average and holds, and selling opportunities when price rallies into an average and turns down, especially in line with the broader trend.
It works on all MT4 timeframes—from M5 for intraday setups to Daily and Weekly for swing and position trades. Higher timeframes tend to give more reliable reactions.
No. It should be used alongside basic trend analysis, candlestick patterns and possibly oscillators. It mainly provides structured levels for entries, stops and targets.
Trendlines, RSI, MACD and horizontal support/resistance can all confirm whether price reaction at a Fibonacci average is part of a strong continuation or a potential reversal.
3 Downloads
Published:
Dec 17, 2025 13:25 PM
Category: