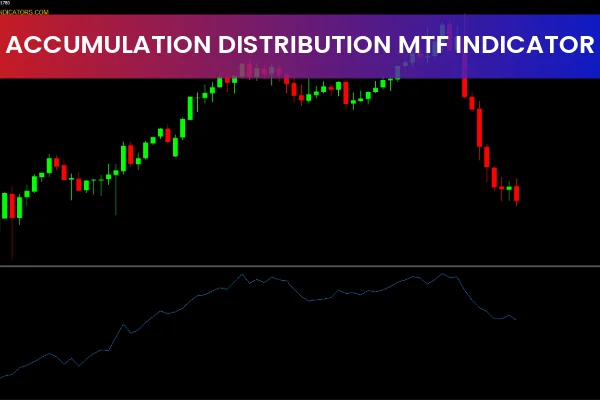
The Accumulation Distribution MTF Indicator for MetaTrader 4 is designed to monitor continuous accumulation and distribution within the price of an asset. Its algorithm analyzes changes in both volume and price, making it highly effective for understanding market strength and money flow.
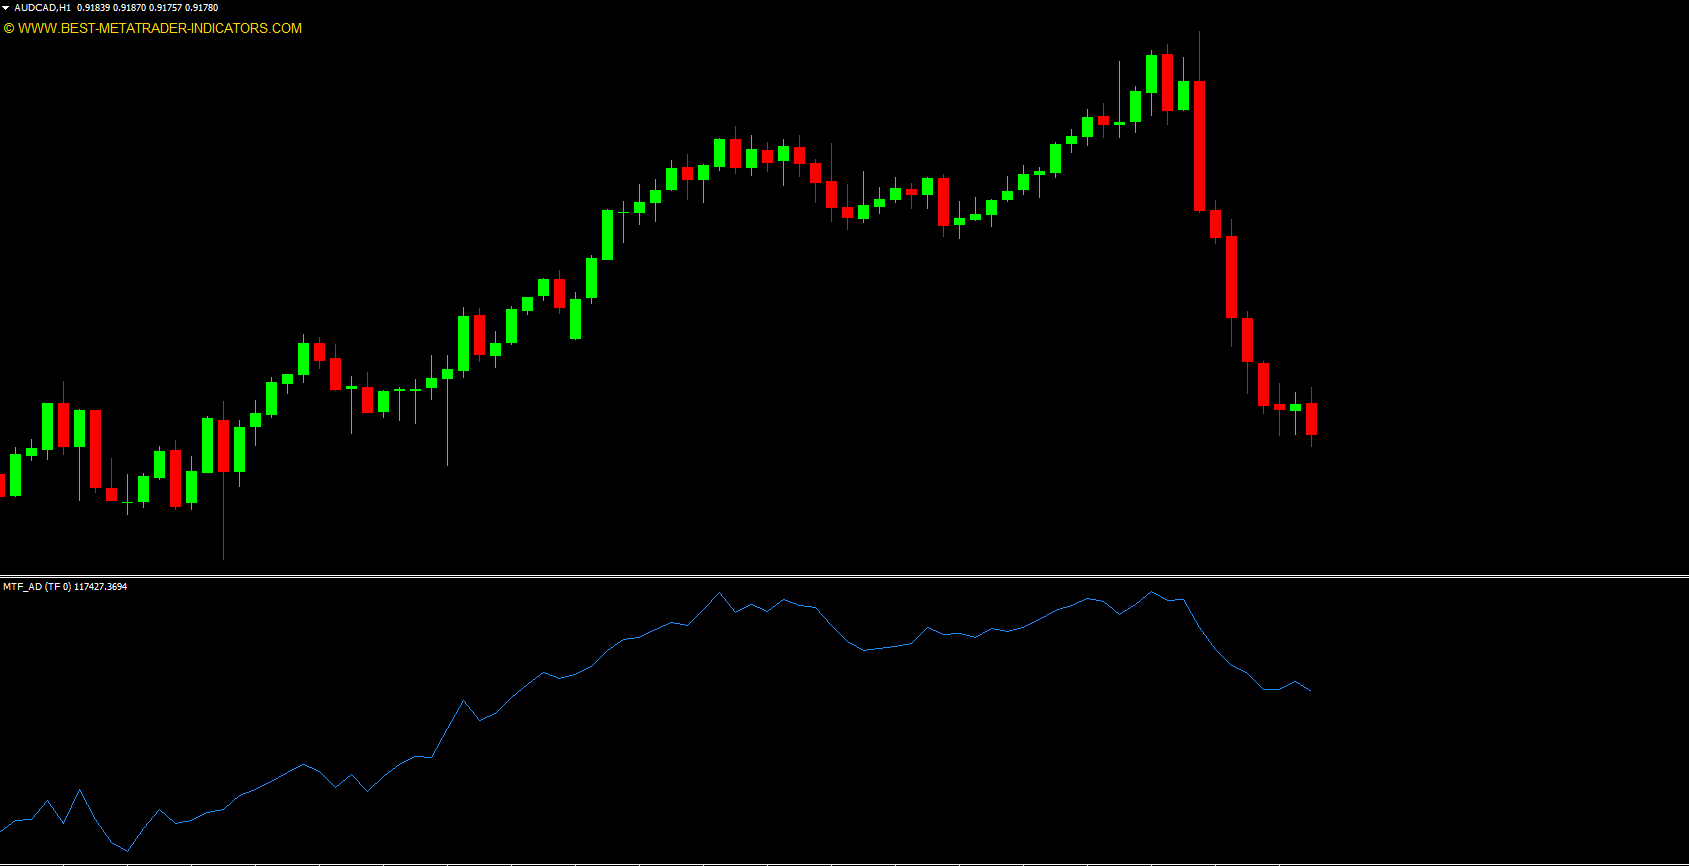
By tracking the movement of capital between buyers and sellers, the indicator helps traders determine trend direction (bullish or bearish) and identify potential reversal zones. This makes it a useful tool for technical analysis across all market types.
How the Accumulation Distribution MTF Indicator Works
The indicator plots a blue line in a separate window, which moves between positive and negative zones:
Positive Zone → Accumulation / Buying Pressure
Indicates more money flowing into the asset.
Negative Zone → Distribution / Selling Pressure
Indicates capital moving out of the asset.
A bullish trend is confirmed when the indicator’s blue line continues to move upward over time.
A bearish trend forms when the line trends downward.
The indicator becomes even more powerful when combined with price action or divergence analysis, helping traders spot early reversal points or confirm Trend Continuation.
Trading the Accumulation Distribution MTF Indicator
Here are several effective ways to trade with this indicator:
Trend Confirmation
If the indicator line consistently rises while price is trending upward → strong bullish trend.
If both price and indicator move downward → strong bearish trend.
Identifying Reversals Using Divergence
Bullish divergence: price makes lower lows while the indicator makes higher lows → potential upward reversal.
Bearish divergence: price makes higher highs while the indicator makes lower highs → potential downward reversal.
Multi-Timeframe Confirmation
Since it is an MTF (multi-timeframe) indicator, traders can analyze higher-timeframe accumulation/distribution while trading on lower timeframes for more accurate entries.
Conclusion
The Accumulation Distribution MTF Indicator for MT4 is a powerful technical tool that provides deep insight into money flow, Trend Strength, and potential reversal points. It is suitable for both beginner and advanced traders—and it is available for free download.
FAQ
Published:
Dec 07, 2025 10:23 AM
Category: