Navigating Trend Strength: The ADX Color MTF Indicator Explained
In technical analysis, identifying the direction of a trend is only half the battle. To build a highly profitable trading strategy, a trader must also evaluate the underlying velocity and strength of that trend. Entering a position during a weak, faltering market layout often results in capital stagnation or unexpected stop-outs during sudden whipsaws. The ADX Color MTF Indicator updates Welles Wilder’s classic Average Directional Index (ADX) framework, wrapping a multi-timeframe (MTF) engine into a clean, color-coded sub-window to help traders filter out flat consolidation zones and spot powerful institutional expansion phases.
Here is an analysis of how this visual oscillator streamlines price data and how to use it to optimize your market entries.
Understanding the Multi-Timeframe ADX Framework
The traditional Average Directional Index is a non-directional technical oscillator, meaning its values scale higher regardless of whether the asset is in a massive markup phase or a deep liquidation spiral. A reading above 25 generally indicates a strong trending environment, while a reading below 20 signals a weak, directionless trend or horizontal channel.
The ADX Color MTF Indicator takes this mathematical backbone and advances it in two crucial ways:
- Visual Color Mapping: Instead of forcing traders to manually track a single wandering line against static horizontal grid lines, the indicator converts the data path into clear, solid vertical bars that switch colors based on momentum.
- Multi-Timeframe Coordination: It pulls higher-timeframe data and projects it directly onto your execution screen. This ensures you are never caught trading against a major macro trend while navigating short-term intraday charts.
Analyzing the Color-Coded Bars on Daily Charts
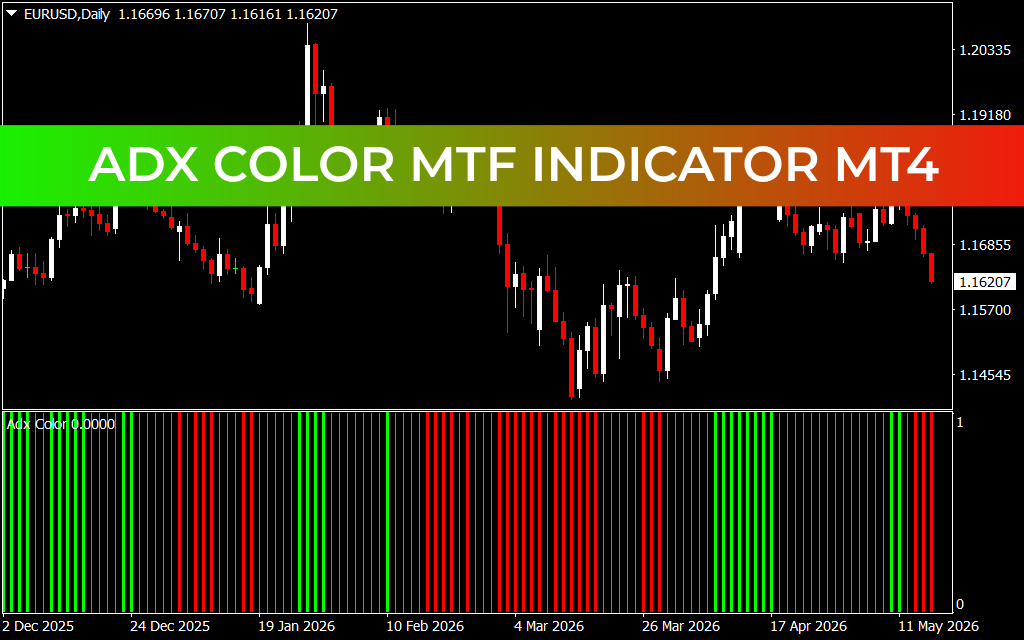
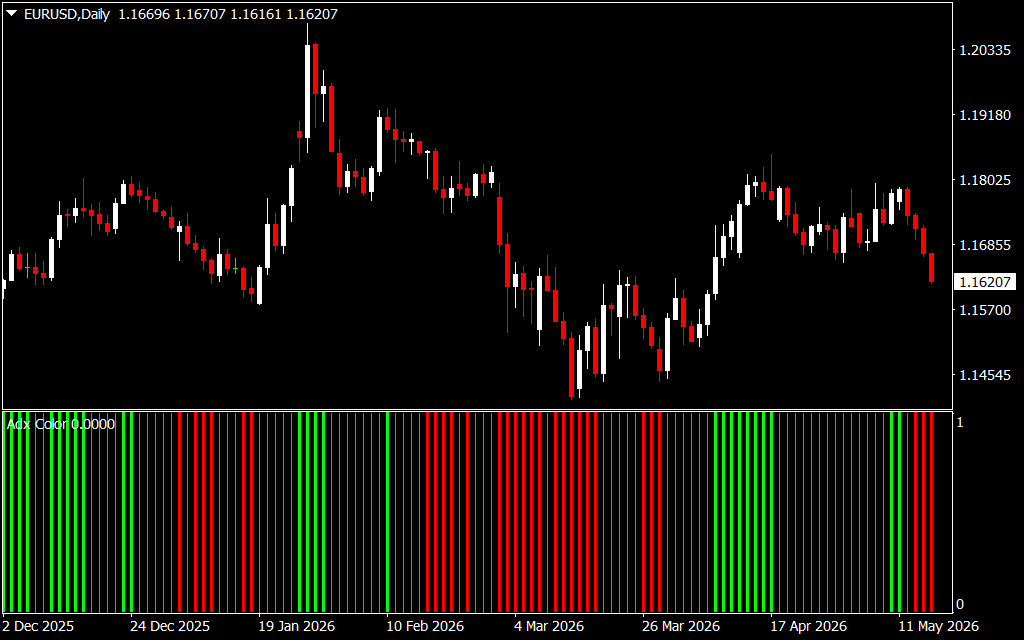
As demonstrated on the EUR/USD Daily chart, the indicator runs smoothly in a dedicated sub-window beneath the main candlestick window, replacing complex line crossovers with a scannable, structural bar chart:
- The Neutral Consolidation Fields (Grey Bars): When the market enters a low-volume contraction zone or a choppy distribution period, the vertical bars turn grey. This visual alert warns systematic traders to stand aside and avoid getting chopped up in range-bound market noise.
- The Strong Bullish Expansion (Green Bars): When a trend gathers immense upward speed and the buyers take decisive control, the indicator prints bright green bars. The taller the bars, the more intense the underlying institutional buying pressure.
- The Strong Bearish Liquidation (Red Bars): Conversely, during severe markdown phases, the oscillator prints bright red bars. These bars confirm a high-velocity downward trend, signaling that selling pressure is rapidly accelerating.
Professional Strategies for Chart Implementation
To extract maximum structural edge from the ADX Color MTF engine on your terminal, implement these active execution guidelines:
- Objective Trend Filtering: Use the indicator as an absolute green-light system. If the sub-window is printing solid red bars on the Daily or H4 chart, restrict your lower-timeframe execution models strictly to high-probability short continuations.
- Timing Breakout Momentum: Watch for transitions out of grey bars. When a long string of grey bars suddenly switches to a bright green or red bar, it indicates that a quiet consolidation phase has ended and a volatile breakout is officially underway.
- Preventing Overextended Entries: When the colored bars reach extreme vertical heights, it serves as a warning that the current trend is mathematically overextended, signaling you to tighten your stop-loss margins rather than chasing new positions.
4 Downloads
Last Update:
May 17, 2026 02:13 AM
Published:
Jan 20, 2026 22:41 PM
Category: