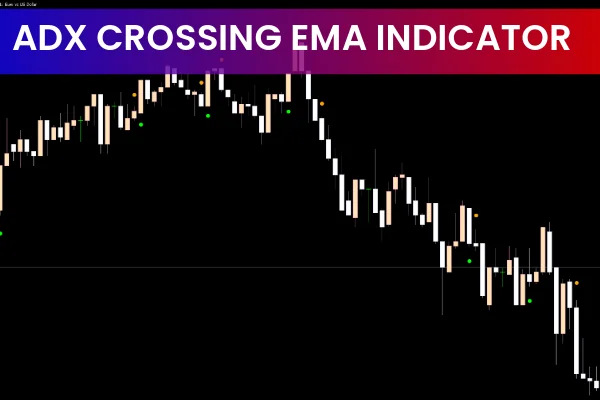
The Average Direction Index (ADX) is a popular tool for assessing trend strength, but interpreting -D1 and +D1 crossovers can be confusing for many traders. The ADX Crossing MA Indicator for MT5 simplifies this process by providing clear buy and sell signals with colored dots.
What is the ADX Crossing MA Indicator?
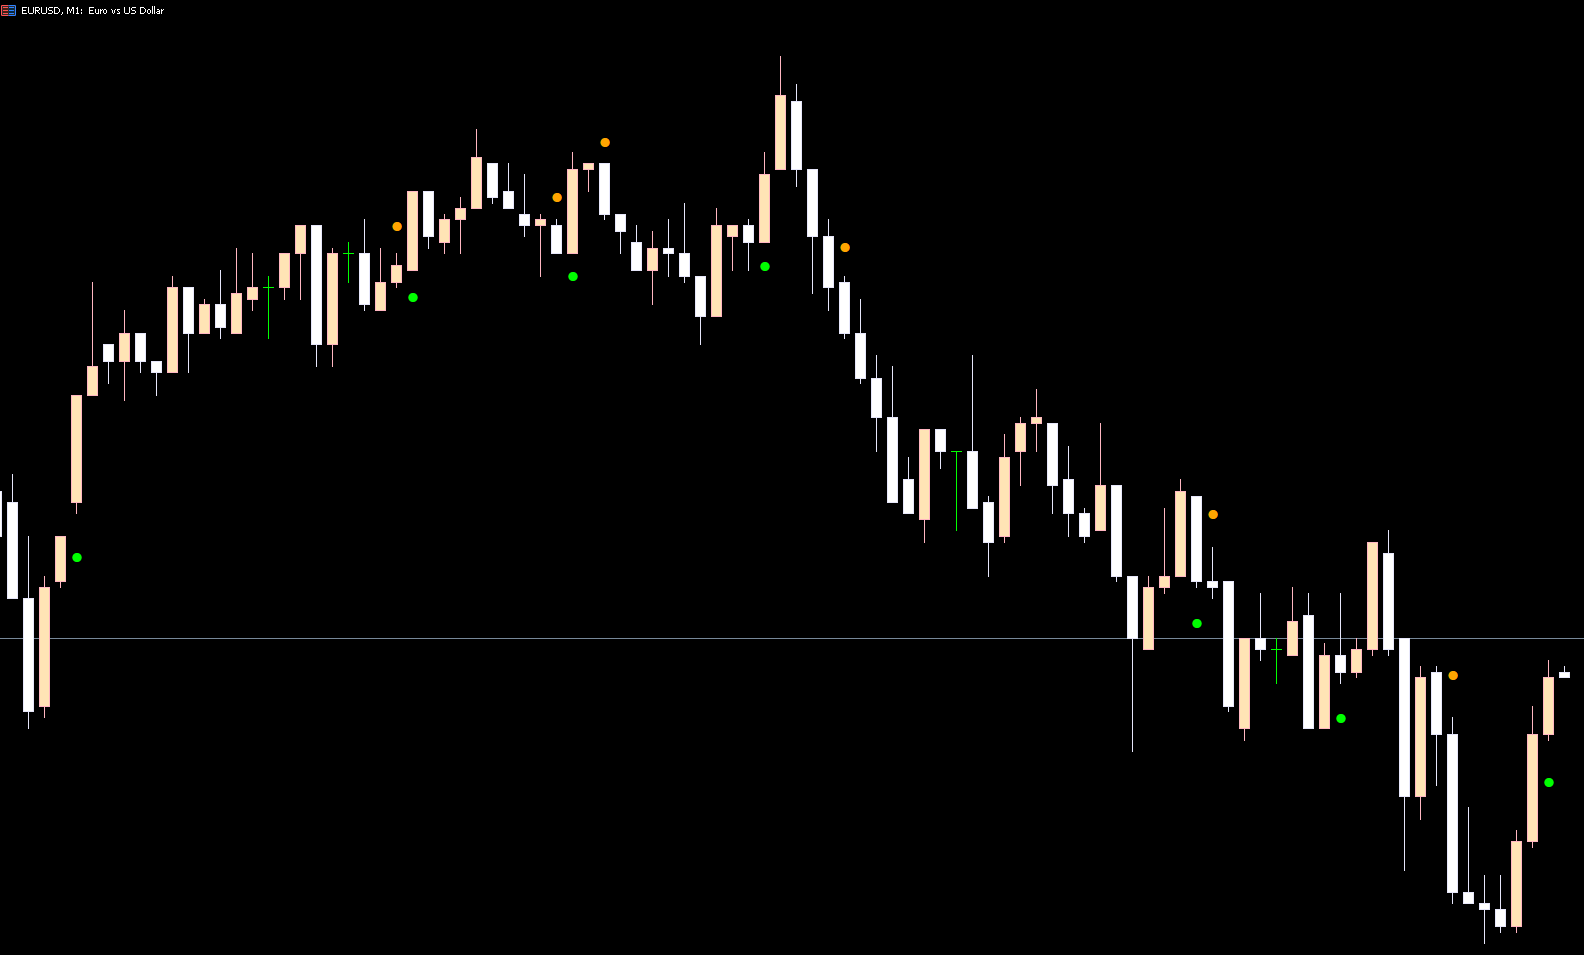
The ADX Crossing MA Indicator is an MT5 tool that determines trend direction and strength. It generates:
Green Dots: Indicating buy signals for potential long positions.
Orange Dots: Indicating sell signals for potential short positions.
This visual system makes it easier for traders to spot entry points without manually calculating ADX crossovers.
How to Use the ADX Crossing MA Indicator
Buy Signals
Enter a long trade when a green dot appears.
Confirm with a bullish candlestick pattern, such as a bullish engulfing candle.
Support And Resistance levels can further improve trade accuracy.
Sell Signals
Enter a short trade when an orange dot appears.
Confirm with bearish Candlestick Patterns, such as bearish engulfing or spinning top candles.
Use support and resistance levels to determine stop-loss and take-profit points.
Recommended Timeframes
H1 (1-hour)
H4 (4-hour)
Daily charts
Using higher timeframes can help filter false signals and increase the accuracy of trades.
Benefits of Using the ADX Crossing MA Indicator
Simplifies ADX Complexity: Easy-to-read buy and sell signals with colored dots.
Trend Detection: Identifies both Trend Strength and direction.
Versatile: Works in trending, ranging, and sideways markets.
Compatible with Price Action: Can be combined with candlestick patterns, support/resistance, and other technical indicators for better accuracy.
Conclusion
The ADX Crossing MA Indicator for MT5 is a valuable tool for forex traders seeking to identify trend direction and entry points with minimal confusion. For best results, combine the indicator with candlestick patterns, price action strategies, and support/resistance analysis.
Discover more MT5 trading indicators and strategies at IndicatorForest.com.
FAQ
2 Downloads
Published:
Nov 17, 2025 01:43 AM
Category: