Maximize Your Trend Trading Strategy with the Advanced ADX Indicator
Trading in the direction of a strong market trend is one of the most reliable ways to secure profits in forex. However, many retail traders fail because they cannot distinguish between a highly aggressive trend and a weak, choppy market distribution. The ADX (Average Directional Index) indicator for MetaTrader is engineered to eliminate this ambiguity. By measuring both Trend Strength and directional momentum simultaneously, this tool helps you stay out of consolidation zones and capture major macroeconomic expansions.
Decoding the Advanced ADX Sub-Window
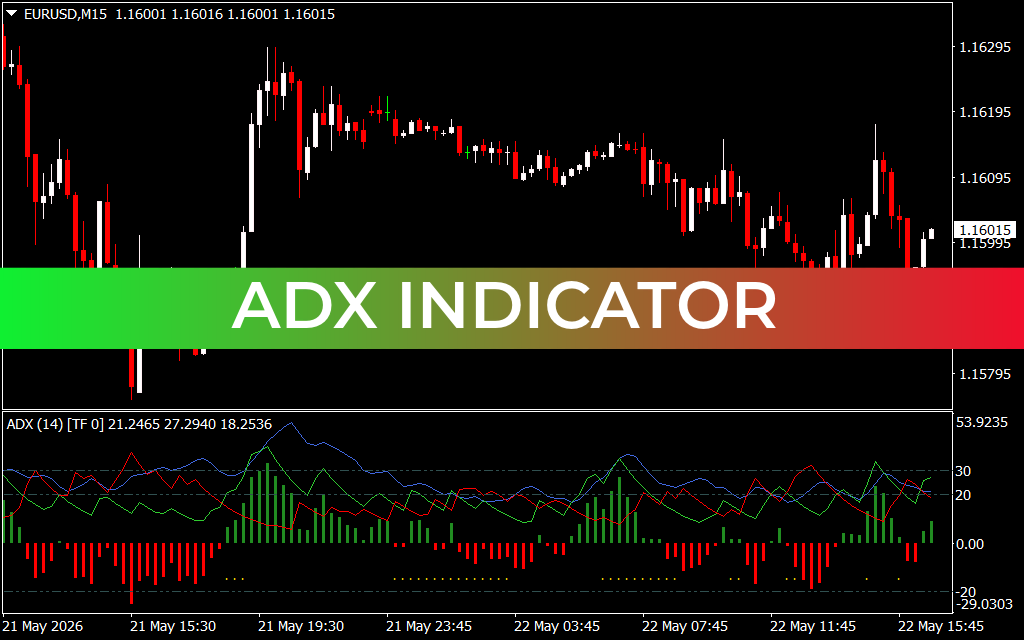
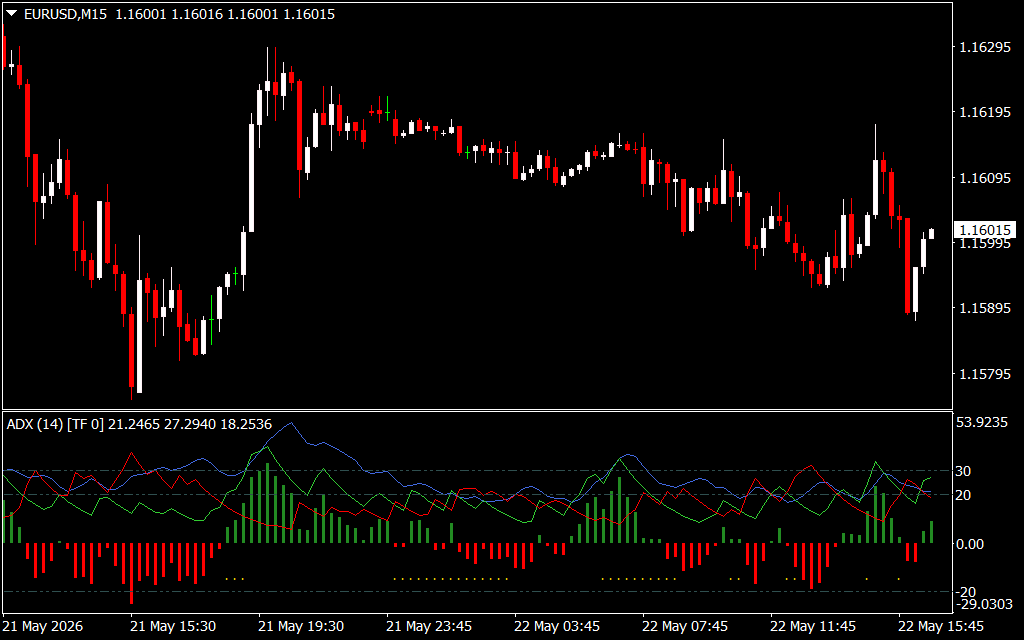
The standard ADX is a classic technical tool, but this advanced modification simplifies analysis by utilizing an integrated oscillator pane beneath your primary candlestick chart. As displayed on the EURUSD M15 chart, the indicator tracks market behavior through three core components that measure institutional order flow:
- The Blue ADX Line: This line measures the absolute strength of the current trend, regardless of whether price is moving up or down. A rising line signals an intensifying trend, while a falling line warns of a consolidating market.
- The Green Line (+DI): Tracks bullish momentum. When the green line rises, buyers are building market dominance.
- The Red Line (-DI): Tracks bearish momentum. When the red line spikes, institutional selling pressure is increasing.
Additionally, this custom indicator features an intuitive histogram layout (green and red vertical bars) along the zero line, accompanied by yellow dot alerts. This visual structure gives traders instant confirmation of momentum shifts without cluttering the main Price Action window.
Key Trading Advantages and Features
- Definitive Trend Strength Filtering: Instantly answers whether the market is trending or ranging, allowing you to deploy the correct breakout or mean-reversion strategy.
- Early Reversal Alerts: Crossings between the +DI (green) and -DI (red) lines serve as reliable structural signals that a trend change is brewing.
- Clear Momentum Histogram: The color-coded vertical bars make it easy to spot accelerating institutional volume during major market sessions.
- Multi-Timeframe Reliability: Highly optimized for lower timeframes like the M15 chart for day trading, yet powerful enough for H4 and daily swing trading.
How to Trade Successfully with the ADX System
To unlock the full potential of the ADX indicator, combine its mathematical strength ratings with classic price action principles:
- Confirm Trend Validity: Before entering any trend-following setup, check the blue ADX line. A value rising above the 20 or 30 thresholds (visible on the right-hand scale) confirms that the market has sufficient momentum to sustain a major move.
- Execute on Crossovers: Look for trade entries when the directional lines cross. For example, when the green line (+DI) crosses above the red line (-DI) while the blue ADX line is climbing, a strong buy signal is triggered. This matches the aggressive upward push seen around the 1.16195 zone on the chart.
- Manage Consolidations: When the indicator prints flat lines and alternating small histogram bars, the market is in a low-volume squeeze. Successful traders use this cue to tighten stop-losses or sit on the sidelines to protect their capital from market chop.
2 Downloads
Last Update:
May 22, 2026 19:47 PM
Published:
Jan 17, 2026 18:42 PM
Category: