Mastering Market Structure: The All Pivots V1 Indicator for MT4
In the fast-paced world of Forex day trading, mapping out key turning points before they happen is the ultimate competitive advantage. Most retail traders populate their screens with lagging, indicator-based overlays that only react after a massive price movement has already occurred. This backward-looking approach often forces entries right at the tail end of a market cycle. To stay ahead of institutional algorithms, professional operators rely on forward-looking, predictive data structures. The All Pivots V1 indicator provides exactly this mathematical edge, serving as an automated, multi-layered blueprint of hidden Support And Resistance floors directly on your active charting terminal.
By calculating floor levels derived entirely from raw mathematical price distributions, this premium utility helps you spot institutional value blocks and key breakout targets instantly.
The Anatomy of Multi-Timeframe Pivot Frameworks
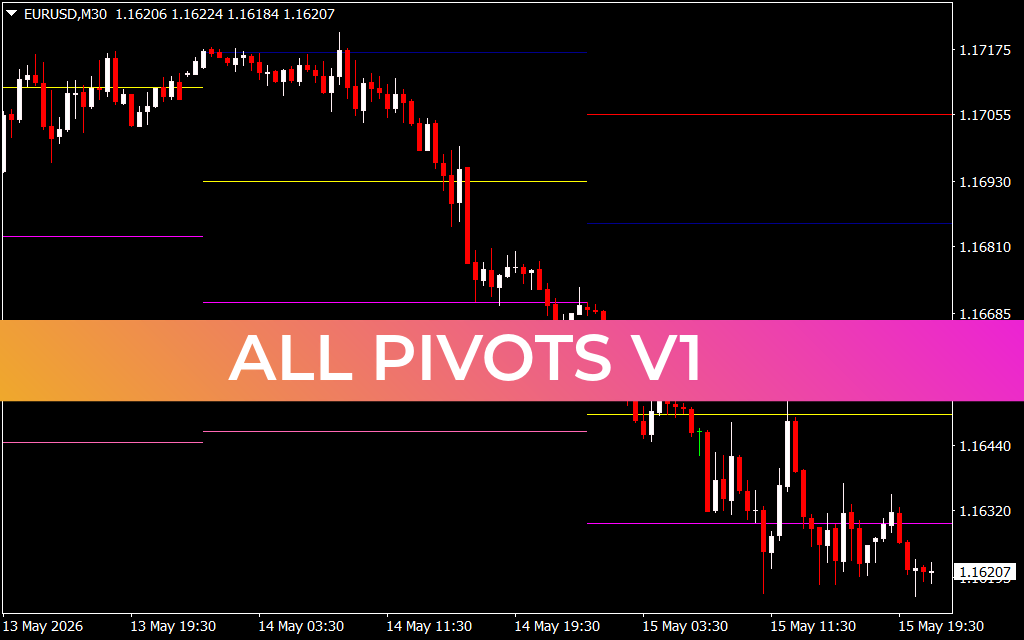
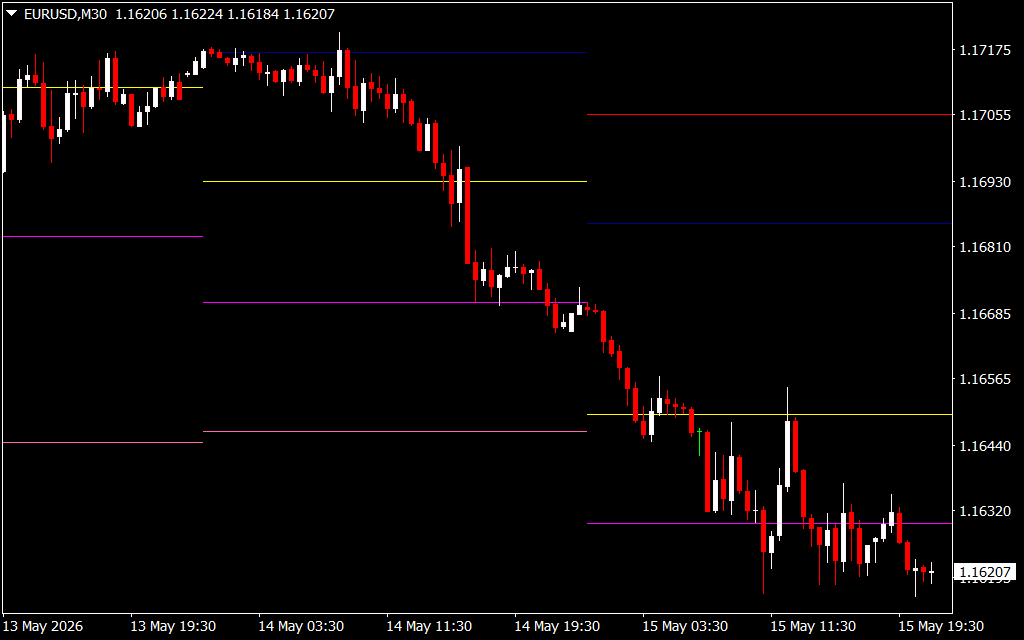
The core benefit of the tool lies in its visual elegance and pure operational clarity. Instead of forcing you to pull up historical daily data sheets and manually map mathematical equations, this software automates your workflow. When loaded onto a liquid currency asset like the EUR/USD on a 30-minute (M30) chart, the system projects a clear matrix of horizontal support and resistance lines:
- The Daily Pivot Baseline (The Yellow Equilibrium Vector): Serving as the psychological anchor point of the entire trading session is a thick yellow baseline. This acts as the ultimate directional filter. When intraday Price Action breaks and stabilizes above the daily pivot vector, the day's structural bias leans heavily bullish; when candles trade below it, sellers maintain control.
- The Institutional Resistance Ceilings (Upper Tier Levels): Suspended systematically above the baseline are color-coded horizontal pathways representing key resistance points. These levels represent prime overhead liquidity pools where smart money algorithms regularly look to distribute long positions or trigger sharp counter-trend rejections.
- The Strategic Support Floors (Lower Tier Levels): Conversely, below the central yellow line are multi-tiered horizontal zones. These boundaries pinpoint key structural demand floors where institutional buyers are likely to absorb sell orders, making them high-probability target zones for mean-reversion scalp entries.
Calibrated for High-Frequency Scalping and Strategy Execution
The All Pivots V1 utility is an indispensable asset for short-term trading styles, including 5-minute Scalping systems, rapid breakout plays, and strict price action rule models. Because these support and resistance thresholds are established at the very beginning of the session, they do not recalculate or repaint mid-candle, giving you fixed, unchanging structural boundaries.
Instead of guessing where a fast-moving trend will exhaust itself, you look directly at your pivot layout. When a sudden price expansion drives candles to pierce an outer resistance line, price action scalpers receive immediate validation to monitor for reversal candlestick signatures. Conversely, trend-following traders can utilize these lines as highly precise, objective profit targets or tight stop-loss anchors. By embedding this mathematical mapping engine into your MetaTrader platform, you remove guesswork, filter out market noise, and execute trades with absolute institutional discipline.
1 Download
Last Update:
May 17, 2026 16:58 PM
Published:
Jan 20, 2026 16:03 PM
Category: