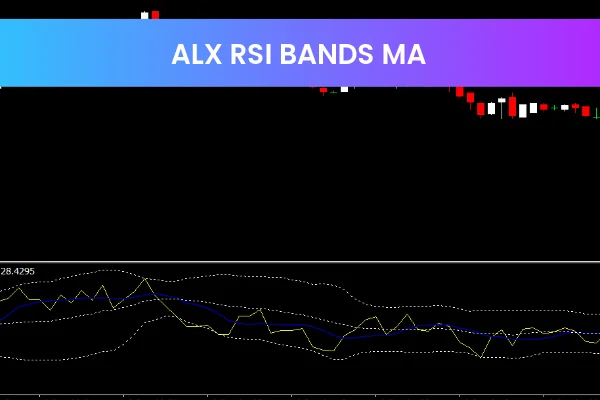
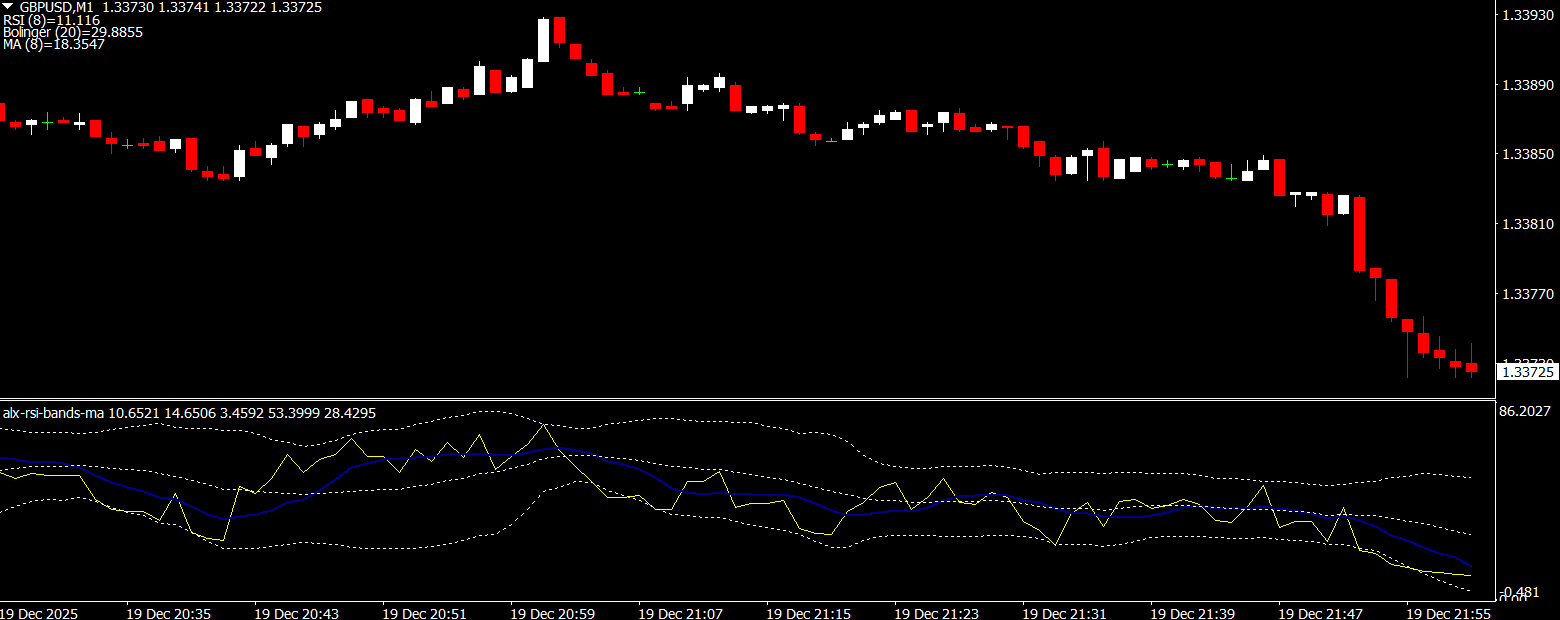
The ALX RSI Bands MA Indicator is a free and popular MT4 forex tool designed to help traders assess market strength and identify potential entry and exit points. By using the Relative Strength Index (RSI), this indicator displays two bands on the chart, signaling overbought and oversold conditions and providing traders with actionable insights.
How the ALX RSI Bands MA Indicator Works
This indicator is based on the RSI, a momentum oscillator that measures the speed and change of price movements. The ALX RSI Bands MA Indicator converts the RSI readings into two visual bands:
Upper Band: Indicates overbought conditions where prices may reverse downward.
Lower Band: Indicates oversold conditions where prices may reverse signal upward.
Traders can use these bands to detect potential market turning points, helping to optimize trade entries and exits.
Benefits of Using the ALX RSI Bands MA Indicator
Market Strength Analysis: Quickly understand whether the market is overbought or oversold.
Entry and Exit Points: Identify ideal positions for opening or closing trades.
User-Friendly: Easy to read and interpret for traders of all levels.
Based on RSI: Leverages the proven Relative Strength Index for accurate momentum analysis.
Free MT4 Tool: Available for download and ready to use on MetaTrader 4.
How to Use the ALX RSI Bands MA Indicator
Install on MT4: Add the indicator to your trading chart.
Monitor the Bands: Watch for price interactions with the upper and lower bands.
Identify Trading Opportunities: Enter trades when the price is near the oversold band and consider exiting or shorting near the overbought band.
Combine With Other Tools: Enhance accuracy by using support/resistance levels, trendlines, or other MT4 indicators.
For a free download and to explore more effective MT4 tools, visit IndicatorForest.com to improve your Forex trading strategy with the ALX RSI Bands MA Indicat
FAQ
1 Download
Published:
Dec 21, 2025 04:19 AM
Category: