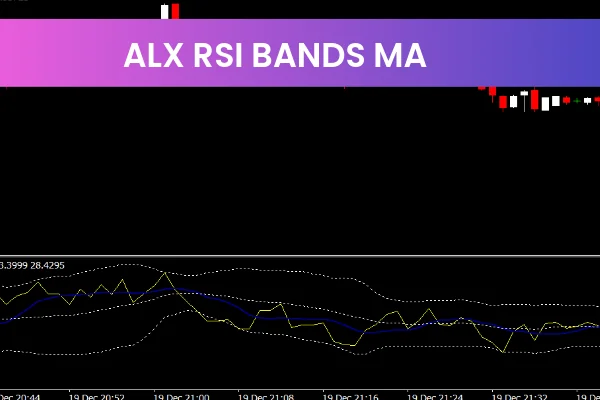
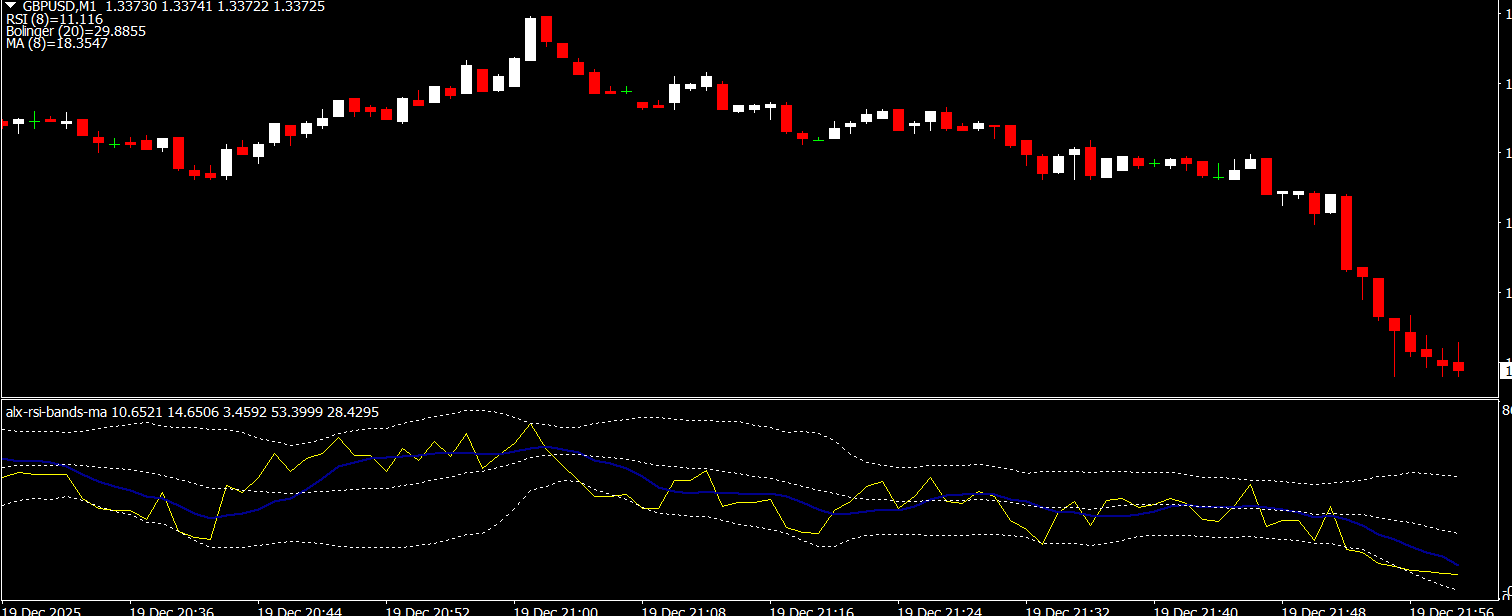
The ALX RSI Bands MA Indicator is a useful and popular free Forex Indicator designed for the MetaTrader 4 platform. It is widely used by traders who want a clear and reliable way to measure market strength and identify overbought and oversold conditions. By using the Relative Strength Index displayed as dynamic bands, the ALX RSI Bands MA Indicator simplifies momentum analysis and supports better trading decisions.
This indicator is suitable for traders of all experience levels. Its visual band-based display allows traders to quickly understand market conditions without complex calculations or multiple indicators on the chart.
How the ALX RSI Bands MA Indicator Works
The ALX RSI Bands MA Indicator is based on the Relative Strength Index, a well-known momentum oscillator that measures the speed and change of price movements. Instead of showing the RSI as a single line, this indicator displays RSI values as two moving bands directly on the chart.
The upper band represents overbought market conditions, indicating that price may be overextended to the upside. The lower band represents oversold conditions, signaling that price may be undervalued and potentially ready for a reversal. By observing how price interacts with these bands, traders can identify potential entry and exit opportunities.
The moving average component helps smooth RSI movements, reducing noise and providing clearer signals during volatile market conditions.
Key Features and Benefits
Uses RSI bands to measure market strength
Identifies overbought and oversold conditions
Helps spot potential trend reversals
Supports precise entry and exit timing
Combines momentum analysis with moving averages
Clear and easy-to-read visual display
Reduces false signals during market noise
Works on all currency pairs
Suitable for all timeframes
Free to download and use on MT4
Using the ALX RSI Bands MA Indicator in Trading
To use the ALX RSI Bands MA Indicator, traders simply attach it to any MT4 chart. Once applied, the indicator automatically calculates RSI values and displays the bands in real time. Traders can adjust RSI periods and band settings to suit their trading style.
A common strategy is to look for buying opportunities when price approaches or touches the lower RSI band, especially when supported by other confirmation tools. Selling opportunities may be considered when price approaches the upper RSI band, indicating overbought conditions.
The indicator works well when combined with trend analysis, Support And Resistance levels, or candlestick patterns to improve trade confirmation and risk management.
Why Traders Choose the ALX RSI Bands MA Indicator trend
Traders choose the ALX RSI Bands MA Indicator because it delivers essential momentum information in a simple and visual format. It removes the guesswork from RSI interpretation and helps traders react faster to changing market conditions.
Because it is free, easy to use, and adaptable to different trading strategies, the ALX RSI Bands MA Indicator remains a popular choice among MT4 Forex traders looking to improve consistency and confidence.
To download the ALX RSI Bands MA Indicator and explore more professional Forex tools, visit IndicatorForest.com and strengthen your trading strategy today.
Image Sugges
FAQ
Published:
Dec 21, 2025 14:44 PM
Category: