Precision Trading with the Amir Indicator for MT4/MT5
In the fast-paced world of intraday trading, the ability to identify the precise moment when momentum shifts is the key to consistent profitability. While many standard technical tools lag behind Price Action, the Amir Indicator is engineered to provide real-time visual confirmation of market sentiment. Designed primarily for the MetaTrader platforms, this indicator simplifies complex data into an intuitive sub-window histogram, making it a favorite for both scalpers and day traders.
The Logic of the Amir Momentum Histogram
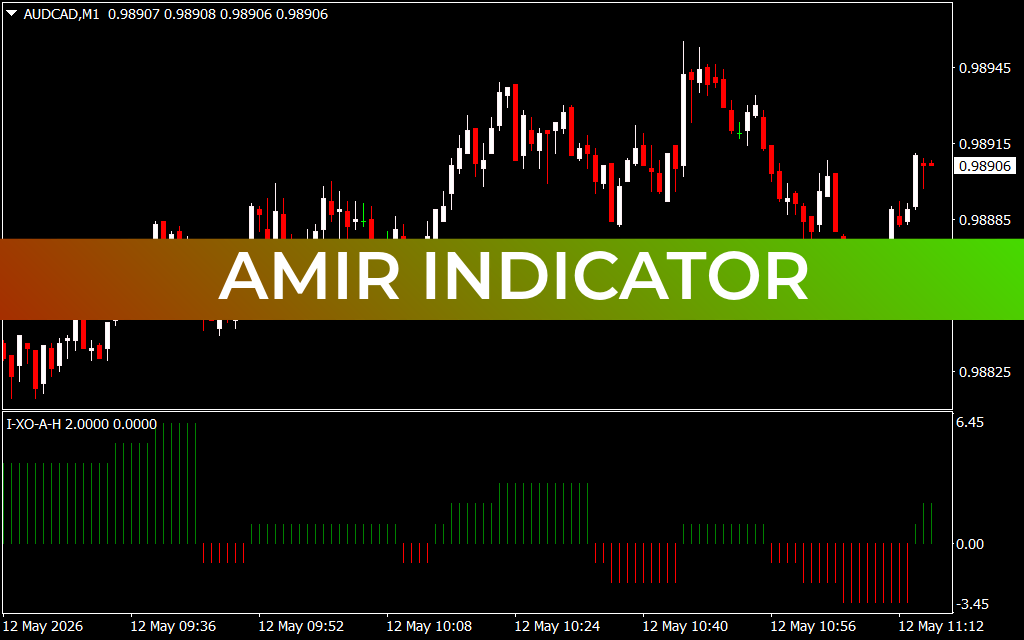
The Amir Indicator operates as a momentum-based oscillator, utilizing a proprietary algorithm to measure the velocity of price changes relative to historical volatility. It visualizes these shifts through a high-contrast histogram:
- Green Pillars (Bullish Dominance): When the green bars expand above the zero line, it indicates a strong influx of buying pressure. As seen in the AUD/CAD M1 chart, the initial transition to tall green bars signals the start of an aggressive bullish expansion, allowing traders to ride the momentum with confidence.
- Red Pillars (Bearish Dominance): Conversely, when the histogram flips below the zero line and turns red, it alerts the trader to increasing selling pressure. This serves as an early warning system to exit long positions or initiate short trades before a full reversal takes hold.
- Histogram Height (Trend Strength): The height of the pillars is directly proportional to the strength of the move. Rising bars suggest a trend is gaining strength, while "step-down" patterns in the histogram warn that momentum is exhausting.
Strategic Benefits for Scalpers and Day Traders
On lower timeframes like the M1 or M5, market "noise" can often trigger false entries. The Amir Indicator acts as a sophisticated filter to ensure your trades are backed by genuine market flow:
- Zero-Line Crossover Strategy: A classic entry technique involves waiting for the histogram to cross the zero line. A crossover from red to green suggests a bullish breakout, while a move from green to red indicates a bearish breakdown.
- Divergence Detection: One of the most powerful uses of the Amir Indicator is identifying momentum divergence. If price makes a new high but the Amir histogram produces a lower peak, it signals that the trend is weakening—often preceding a major price correction.
- Visual Simplicity: The clean vertical bar design prevents chart clutter, allowing you to focus on price action in the main window while receiving instant sentiment updates from the sub-window.
Implementation and Confluence
The Amir Indicator is at its most effective when used in conjunction with Market Structure. For instance, if price reaches a known resistance level and the Amir histogram begins to print shorter green bars or transitions to red, the probability of a successful reversal trade is significantly higher.
By integrating the Amir Indicator into your trading arsenal, you gain a mathematical edge that traditional indicators often miss. It provides the clarity needed to navigate volatile sessions, helping you stay on the right side of the market and capture high-probability moves with surgical precision.
2 Downloads
Last Update:
May 12, 2026 14:17 PM
Published:
Jan 23, 2026 18:09 PM
Category: