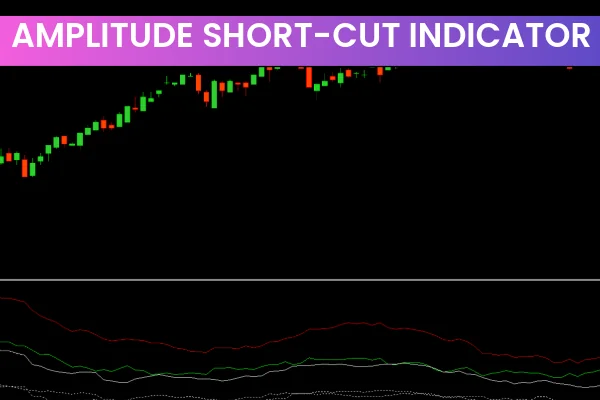
The Amplitude Short-Cut Indicator for MT4 is a powerful technical analysis tool designed to help traders identify price volatility, market strength, and trend reversal opportunities. This indicator is highly valued among Forex traders because it makes it easy to detect market momentum, Trend Continuation, and potential reversal zones. Whether you are a beginner or an advanced trader, the Amplitude Short-Cut Indicator simplifies price behavior and improves the accuracy of trade timing.
What Is the Amplitude Short-Cut Indicator?
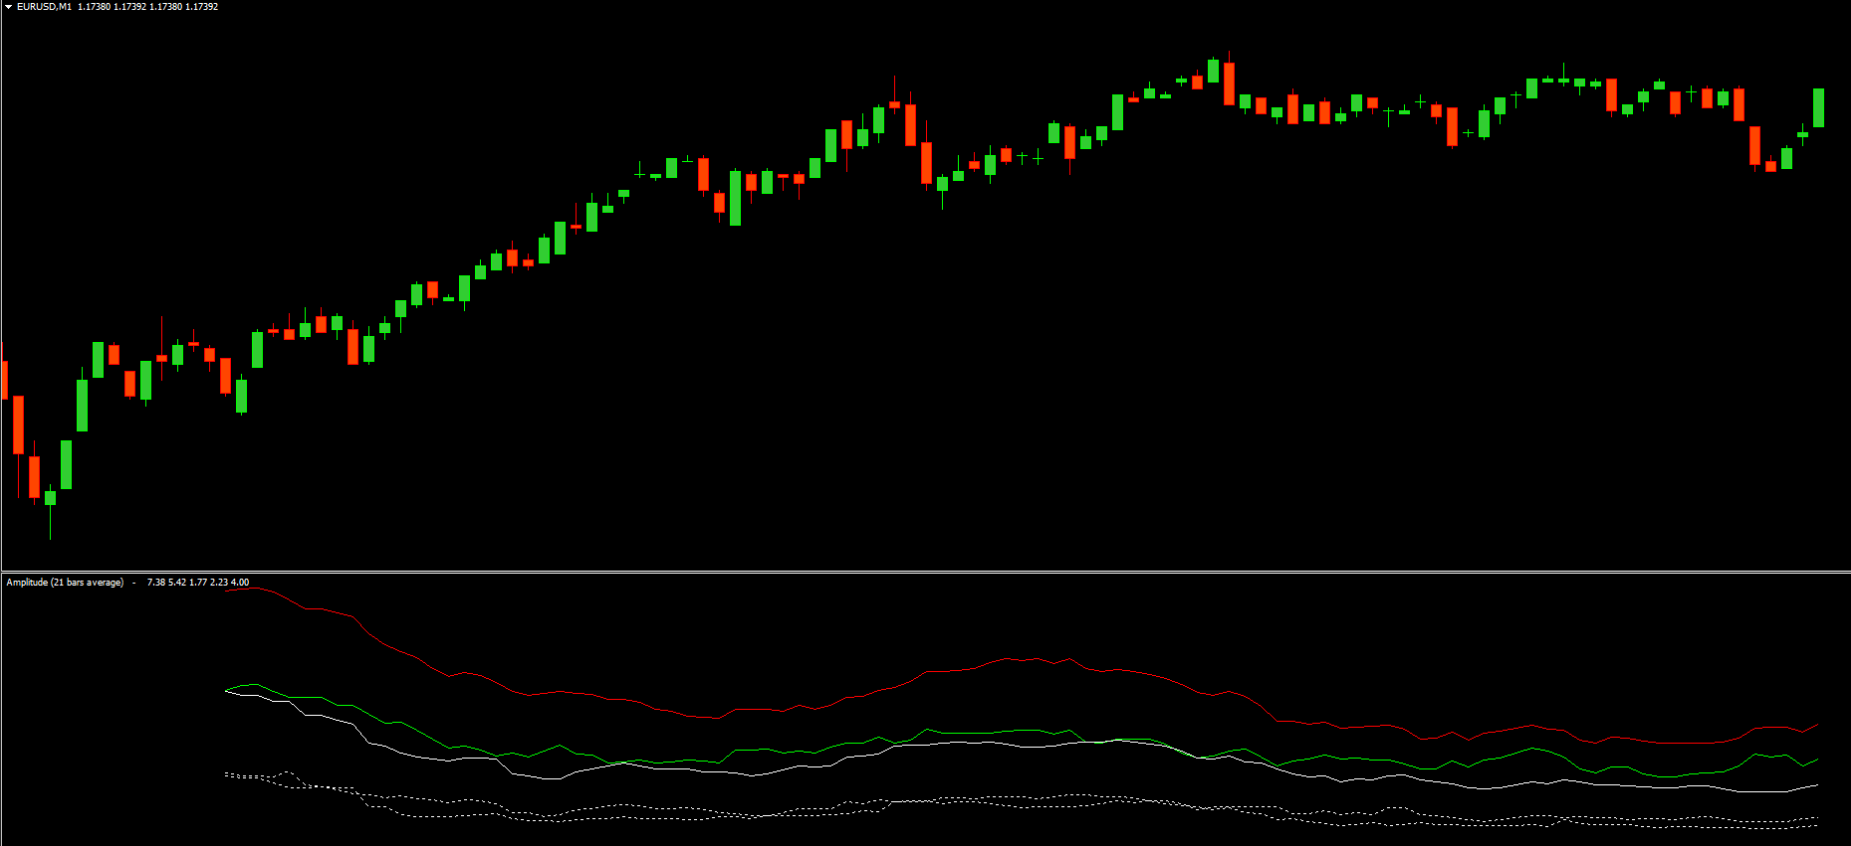
The Amplitude Short-Cut Indicator measures the difference between the highest and lowest price of a trading period. This price amplitude helps traders interpret volatility conditions, which is crucial in detecting shifts in market direction. By plotting three visual lines — red, green, and white — the indicator reveals when buyers or sellers are gaining control.
In technical trading, volatility often signals market strength or weakness. The Amplitude Short-Cut Indicator for MT4 provides this information visually, making it easier for traders to analyze price movement and make informed decisions.
How the Indicator Works
The tool includes three key plot lines:
Red Line: Indicates volatility strength. A rising red line means increasing volatility and momentum.
Green Line: Represents bullish activity and upward trend shifts.
White Line: Serves as a baseline to determine when price momentum is changing direction.
When the green line crosses above the white line, and the red line also trends upward, it suggests a potential bullish trend. This scenario may signal a possible buy. On the other hand, if the green line crosses below the white line with the red line declining, bearish momentum is increasing and a potential sell setup forms.
How to Trade Using the Amplitude Short-Cut Indicator
The Amplitude Short-Cut Indicator can be used on multiple trading timeframes, including Scalping, day trading, and swing trading. The most common approach is:
Buy Setup:
Green crosses above white + red rising → potential bullish reversal.
Sell Setup:
Green crosses below white + red declining → bearish confirmation.
For optimal accuracy, traders often combine this MT4 indicator with other tools such as:
Moving Averages
RSI or MACD
Support And Resistance levels
This combination improves signal confirmation and reduces false entries.
Benefits of Using the Amplitude Short-Cut Indicator
Using the Amplitude Short-Cut tool offers several trading advantages:
Helps identify trend reversals early
Improves trade timing and precision
Works across Forex pairs, indices, metals, and crypto CFDs
Clear visual interface for all trading skill levels
Tracks volatility in real-time
These advantages make it a reliable indicator for developing structured and profitable trading strategies.
Download from IndicatorForest.com
You can download the Amplitude Short-Cut Indicator for MT4 free from IndicatorForest.com, along with many other MT4 and MT5 tools designed to improve consistency and decision-making. Explore additional indicators such as the MBFX Timing Indicator to build a more effective technical setup.
Additional Learning Resources (External Authority Links)
Investopedia: Technical Analysis Guide
Babypips: Forex Volatility and Indicators
Final Thoughts
The Amplitude Short-Cut Indicator for MT4 is a valuable tool for tracking volatility and detecting trend reversals with precision. Whether you are refining your strategy or developing new trade rules, this indicator helps improve decision-making, trade execution, and risk control.
Visit IndicatorForest.com now to download the indicator for free and explore more advanced trading tools.
FAQ
1 Download
Published:
Dec 07, 2025 11:23 AM
Category: