Unlock Market Secrets with Another VSA Version Two
In the financial markets, price is the effect, but volume is the cause. Most retail traders focus solely on Price Action, missing the hidden footprints left by institutional players. Another VSA Version Two is a powerful technical indicator designed to bring Volume Spread Analysis (VSA) to your charts, allowing you to see where "Smart Money" is entering or exiting the market.
What is Volume Spread Analysis?
VSA is a trading methodology that establishes the relationship between price movement, the spread (the range of the candle), and the volume. By analyzing these three factors, traders can determine the Supply And Demand balance. Another VSA Version Two automates this complex process, translating raw data into color-coded histograms that signal market strength or weakness.
Why Use Another VSA Version Two?
Standard volume bars only tell you how much activity occurred, but they don't tell you the intent. This Version Two update provides a more nuanced interpretation:
- Identify Accumulation and Distribution: See when large institutions are quietly buying at the bottom or selling at the top.
- Spot No-Demand and No-Supply: Recognize when a market move lacks professional backing, allowing you to avoid "bull traps" and "bear traps."
- Clarity on Momentum: High-volume bars with wide spreads confirm a trend's health, while high volume on narrow spreads often signals a "climax" or turning point.
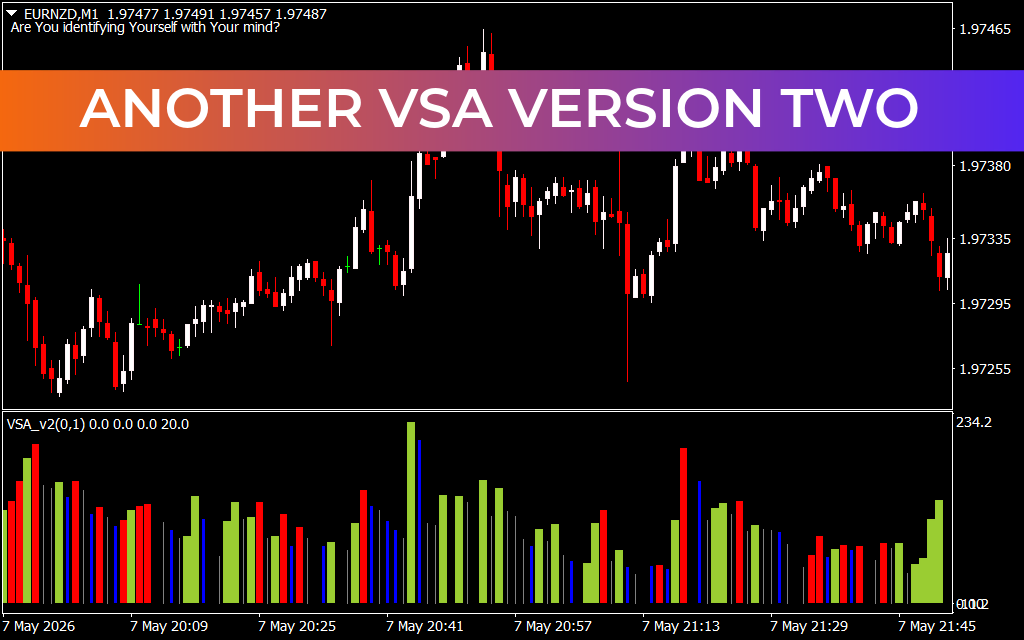
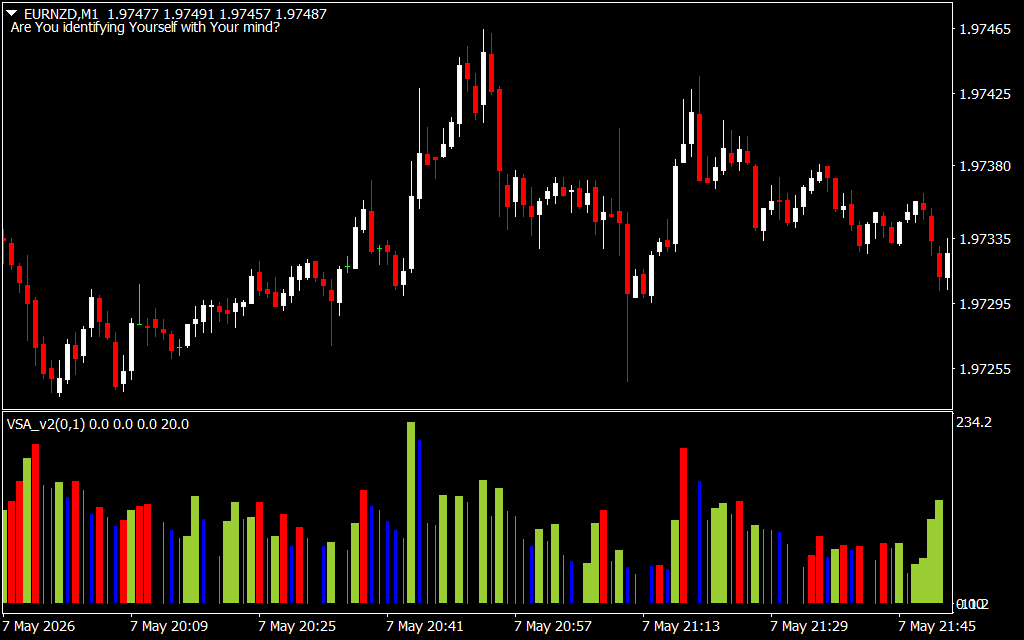
- Enhanced Visual Coding: The indicator uses distinct colors (such as red, green, blue, and grey) to represent specific market conditions like "Stopping Volume" or "Effort versus Result."
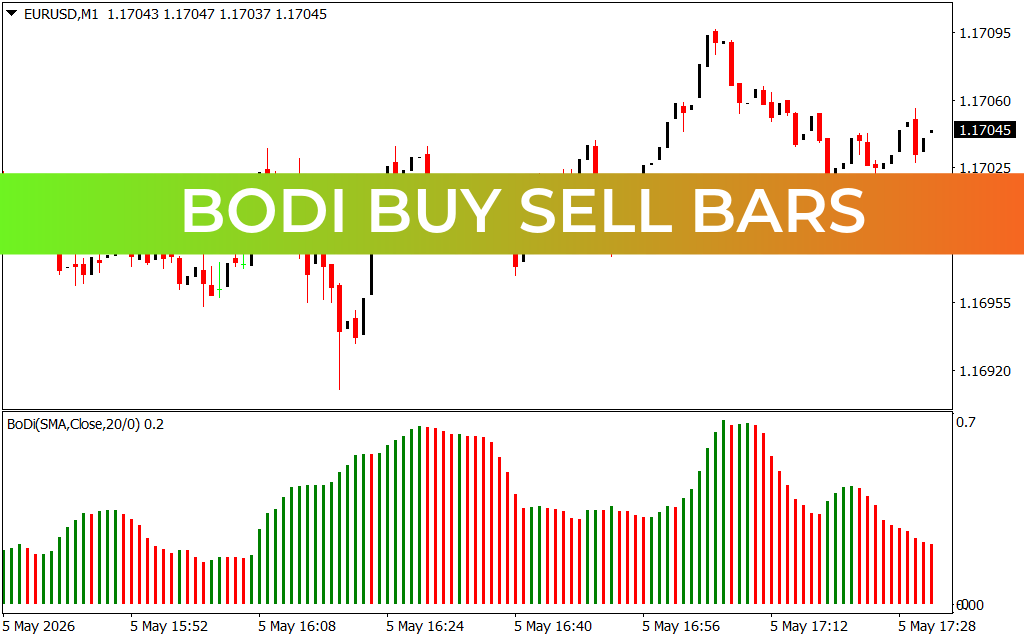
Trading with VSA on Lower Timeframes
As seen on the M1 chart, Another VSA Version Two is exceptionally effective for scalpers. In fast-moving markets, volume spikes often precede significant price reversals. By watching the histogram for climatic volume bars, a trader can anticipate when a move has exhausted itself. When used alongside Support And Resistance levels, this indicator becomes a high-probability filter for any strategy.
Instead of guessing where the market will go, trade based on the actual activity of the professionals. This indicator takes the guesswork out of volume analysis, giving you the clarity needed to follow the path of least resistance.
1 Download
Last Update:
May 08, 2026 03:03 AM
Published:
Jan 25, 2026 22:21 PM
Category: