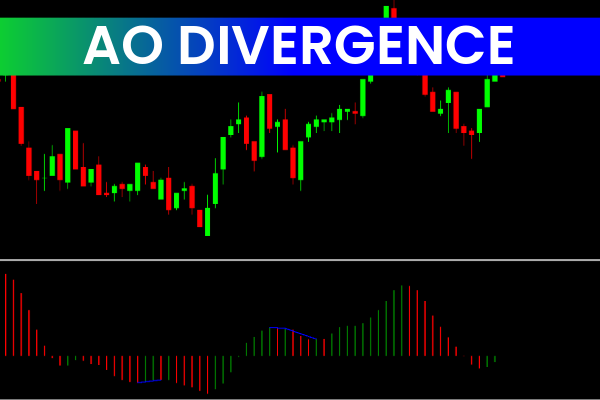
The AO Divergence Indicator is a powerful technical analysis tool designed for Forex traders to spot divergence patterns between the Awesome Oscillator (AO) and the price of a currency pair. By analyzing these divergences, traders can uncover potential trading opportunities and better anticipate market reversals or trend continuations.
Understanding the AO Divergence Indicator
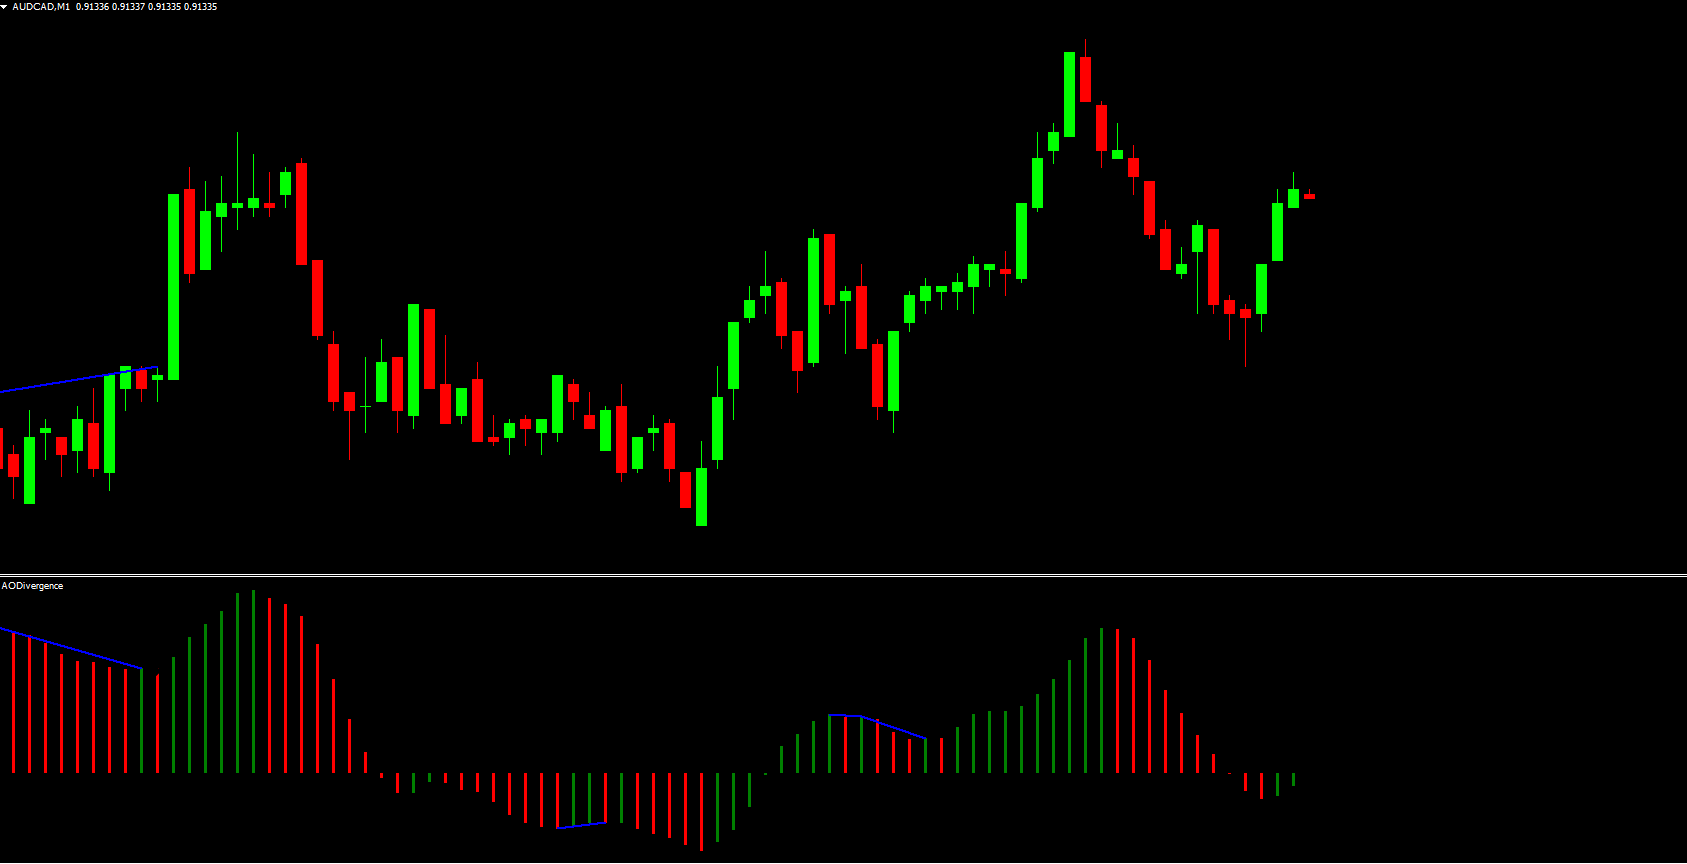
Divergence occurs when the price of a currency pair moves in one direction while the AO indicator moves in the opposite direction. This discrepancy often signals a weakening trend or a possible reversal, making it an essential tool for traders who rely on divergence-based strategies.
For example, if prices are making higher highs while the AO forms lower highs, this bearish divergence can indicate that the upward momentum is weakening, and a downward reversal may follow. Conversely, when prices create lower lows and the AO forms higher lows, this bullish divergence may signal an upcoming upward trend.
Benefits of Using the AO Divergence Indicator
Trend Reversal Detection: The indicator helps traders identify early signs of market reversals, allowing for timely entry or exit points.
Enhanced Strategy Support: It complements other technical analysis tools like moving averages, RSI, or MACD, providing confirmation for trading decisions.
Suitable for All Levels: Whether you are a beginner learning to interpret divergences or an experienced trader optimizing your strategy, the AO Divergence Indicator provides actionable insights.
How to Use the AO Divergence Indicator Effectively
To use the AO Divergence Indicator, look for divergence signals between Price Action and the Awesome Oscillator. Confirm these signals using additional technical tools or chart patterns to reduce false signals. Applying proper risk management alongside AO divergence signals enhances trading accuracy and helps maintain consistency in Forex trading.
At IndicatorForest.com, we offer detailed guides, tutorials, and tools for traders to fully leverage the AO Divergence Indicator and other technical indicators, helping you make more informed decisions in the Forex market.
Image Suggestions:
ao-divergence-indicator-chart.jpg
ALT text: AO Divergence Indicator showing bullish and bearish divergence signals on a Forex chart
ao-indicator-trend-reversal.jpg
ALT text: Awesome Oscillator divergence used to detect trend reversals
forex-ao-divergence-analysis.jpg
ALT text: Forex chart with AO Divergence Indicator highlighting potential trading opportunities
FAQ
The AO Divergence Indicator spots divergence patterns between the Awesome Oscillator (AO) and the price of a currency pair. Divergence occurs when price moves in one direction while the AO moves in the opposite direction, signaling a weakening trend or possible reversal. This discrepancy helps traders uncover potential trading opportunities and anticipate market reversals or trend continuations.
A bearish divergence occurs when prices make higher highs while the AO forms lower highs, indicating that upward momentum is weakening and a downward reversal may follow. Conversely, a bullish divergence appears when prices create lower lows and the AO forms higher lows, signaling an upcoming upward trend.
The indicator helps traders identify early signs of market reversals, allowing for timely entry or exit points. By analyzing divergences, traders can anticipate trend reversals before they fully develop, providing an early warning system that helps improve trade timing and decision-making.
Look for divergence signals between price action and the Awesome Oscillator, then confirm these signals using additional technical tools or chart patterns to reduce false signals. Applying proper risk management alongside AO divergence signals enhances trading accuracy and helps maintain consistency in Forex trading.
Whether you are a beginner learning to interpret divergences or an experienced trader optimizing your strategy, the AO Divergence Indicator provides actionable insights. It complements other technical analysis tools like moving averages, RSI, or MACD, providing confirmation for trading decisions across all experience levels.
Published:
Dec 15, 2025 22:39 PM
Category: