Mastering Market Geometry with the Auto Fibonacci Trading Zones Indicator
In the realm of financial market analysis, few tools carry as much mathematical prestige as the Fibonacci sequence. Derived from natural structural ratios, Fibonacci retracement and expansion levels serve as highly reliable maps for identifying where institutional Supply And Demand will shift. However, manually plotting these zones introduces a massive flaw: subjective bias. Choosing the wrong swing high or swing low can result in distorted levels and costly execution errors.
The Auto Fibonacci Trading Zones Indicator eliminates this operational risk by automating chart geometry. Built to scan historical data and identify structural swing pivot points mechanically, this advanced tool anchors precise, mathematical trading fields straight to your trading terminal.
The Architecture of Automated Retracements
At its technical core, the indicator monitors historical candlestick high-and-low sequences across a user-defined lookback period. Once a definitive macro peak and structural valley are confirmed, the software maps out key horizontal grid levels based on classic Fibonacci percentage ratios:
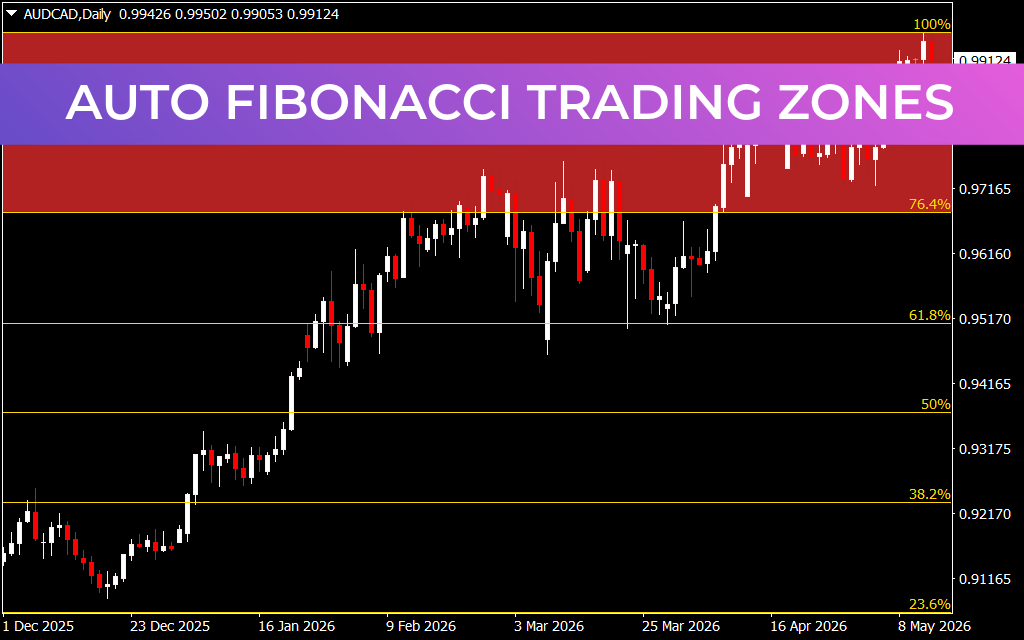
- The Golden Ratios (38.2%, 50.0%, and 61.8%): These mid-tier thresholds represent the classic re-accumulation or distribution territory. When a currency pair pulls back into these layers during a healthy trend, institutional buyers and sellers frequently re-engage, making them premium zones for entry execution.
- The Deep Retracement Floor (23.6%): Serves as an early warning baseline for trend maturity. If Price Action retraces completely down to this deep threshold, it implies the primary trend's structure is undergoing severe decay or entering a major transitional phase.
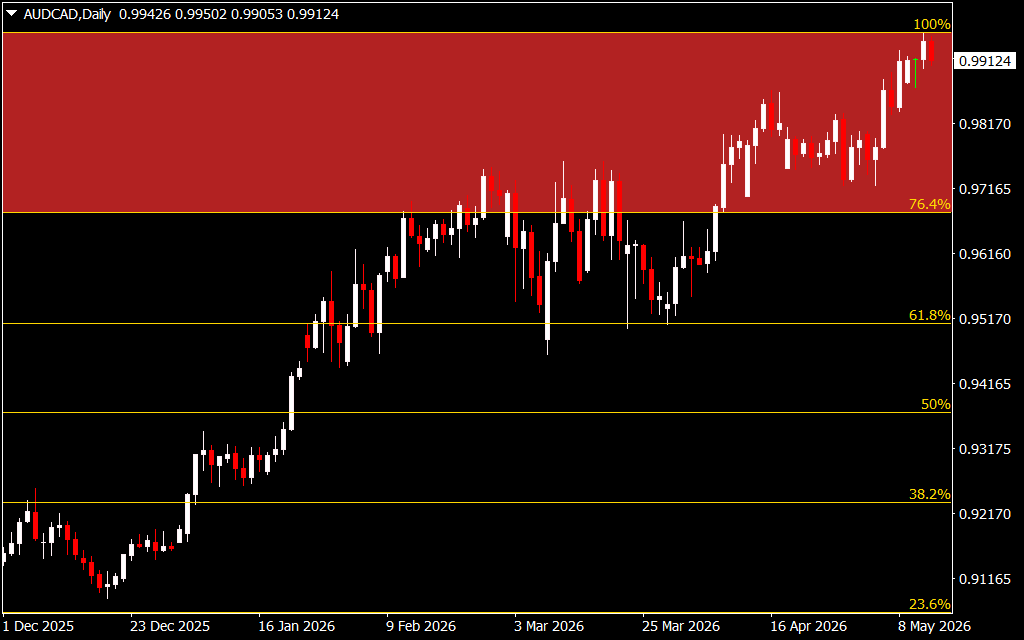
- The Premium Expansion Zone (76.4% to 100%): Highlighted as a prominent structural crimson block on major trend advances, this upper field represents the ultimate acceleration or take-profit matrix. When a pair breaks into this high-value territory, it signals an aggressive extension toward historical price targets.
Implementing Auto Fibonacci into Your Trade Routine
Integrating this automated charting assistant into your daily software setup establishes clear, rule-based execution steps:
- Confluence-Driven Entries: Instead of buying a minor breakout blindly, wait for price action to pull back into an automatically plotted golden zone (such as 61.8%). When a key Fibonacci layer lines up perfectly with a horizontal support level or a moving average line, you have a high-probability confluence setup.
- Objective Profit Targets: The indicator provides explicit, predefined exit parameters. For instance, when long positions are initiated at the lower value zones, the dynamic 76.4% and 100% levels serve as clear mathematical targets to scale out or fully collect profits.
- Systematic Stop Placement: Risk management becomes entirely mechanical with this tool. Stop-losses can be safely placed just beyond the next major horizontal grid line (e.g., entering at 50% and positioning a hard stop underneath the 38.2% baseline), keeping initial drawdowns tightly controlled.
Swing Trading Excellence on the Daily Chart
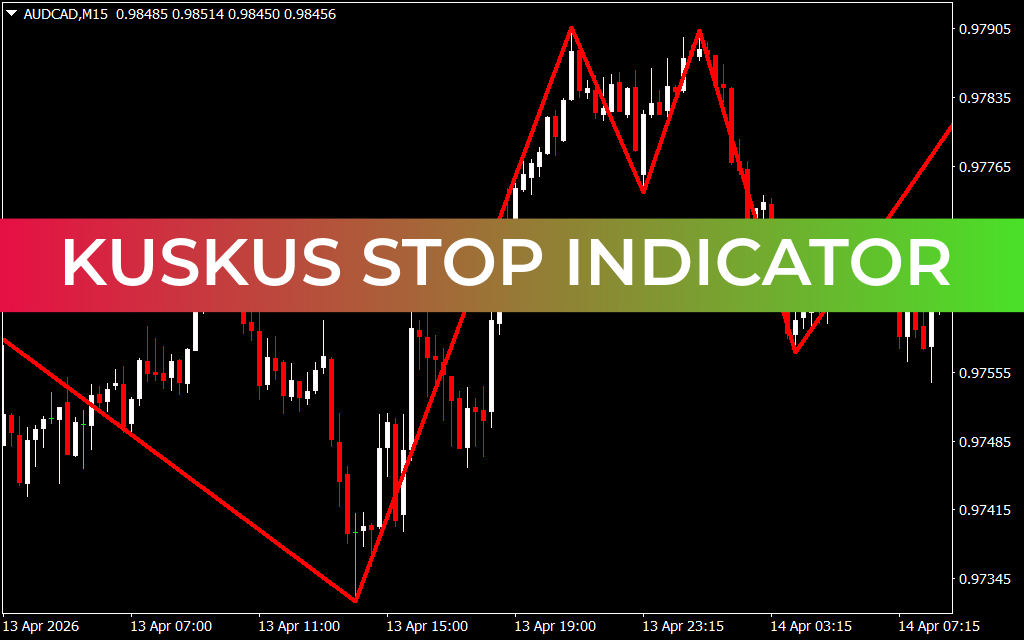
While scalable to shorter intraday timeframes for fast-paced Scalping, the Auto Fibonacci Trading Zones Indicator provides outstanding structural clarity on macro frames like the Daily chart. As displayed on the AUD/CAD Daily layout, the indicator anchors itself over multi-month structural cycles, mapping a clean, multi-hundred pip advance. By allowing the software to handle macro structural tracking, swing traders can maintain an objective, birds-eye perspective on global currency pairs.
6 Downloads
Last Update:
May 14, 2026 21:22 PM
Published:
Jan 22, 2026 00:59 AM
Category: