Navigate Key Reversals with the Auto Pivot Plotter Indicator for MT4
In technical analysis, identifying exactly where institutional supply and demand will enter the market is the key to sustained profitability. Many retail traders clutter their charts with manual trendlines or subjective Support And Resistance zones that fail during volatile market sessions. The Auto Pivot Plotter Indicator for MetaTrader 4 (MT4) eliminates this subjectivity by mathematically calculating and plotting key structural price levels automatically.
By tracking historical price distributions, this indicator provides day traders and swing traders with an objective roadmap of institutional turning points directly on their main chart window.
What is the Auto Pivot Plotter Indicator?
The Auto Pivot Plotter indicator is an automated technical utility that calculates mathematical pivot levels based on the high, low, and closing prices of previous trading sessions. Instead of drawing basic daily lines that lag behind the market, this tool maps out a dynamic, step-like price framework across your screen.
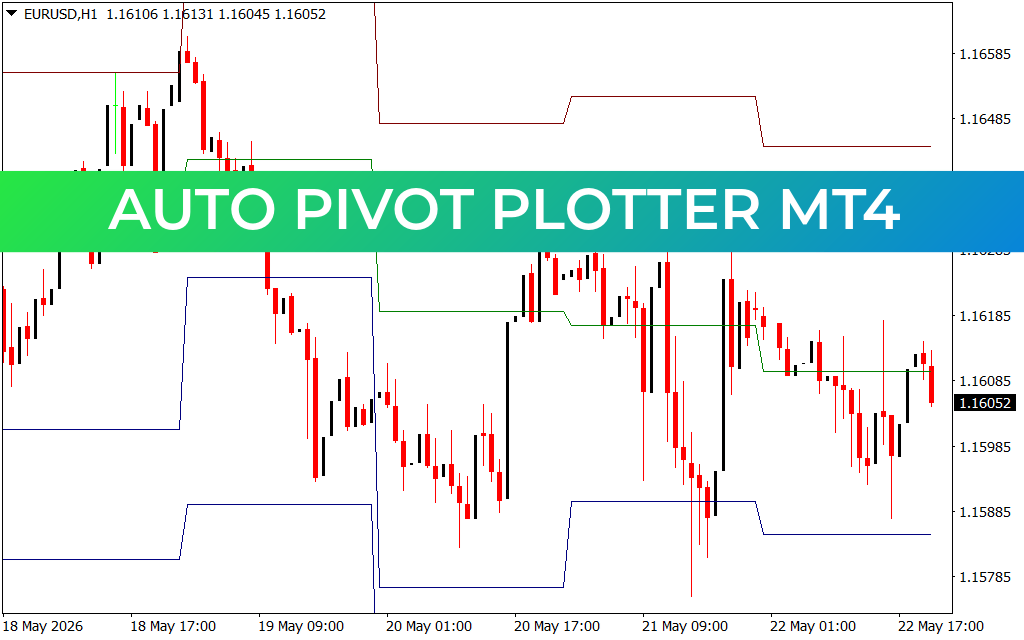
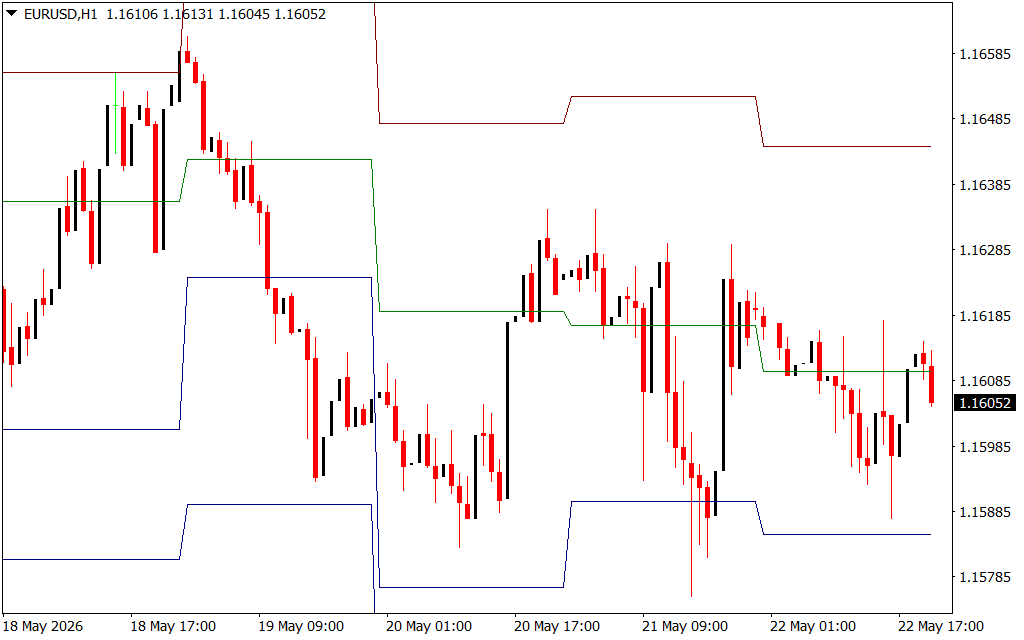
As shown on the EURUSD H1 chart, the indicator plots distinct horizontal boundaries:
- The Central Pivot Line (Green): Serves as the ultimate balance point for the asset. Price trading above this line indicates a dominant bullish sentiment, while price below it signals a bearish environment.
- Resistance Boundaries (Red/Brown): Projected above the central pivot, these levels represent key target areas where buying momentum is likely to exhaust and sellers may step in.
- Support Boundaries (Blue): Projected below the central pivot, these steps represent primary demand zones where downward momentum faces heavy institutional buying pressure.
Key Features and Benefits
- Fully Automated Calculations: Removes the need for manual, daily mathematical updates by automatically drawing fresh pivot steps as new sessions open.
- Step-Like Visual Flow: Features structured, horizontal plateaus that clearly define active support and resistance blocks without interfering with your candlesticks.
- Multi-Timeframe Accuracy: Functions perfectly on major intraday timeframes like the H1, making it an excellent anchor tool for both scalpers and swing traders.
- Objective Risk Parameters: Provides definitive technical levels for setting precise stop-losses and profit targets, removing emotional guesswork from your execution.
How to Trade with Auto Pivot Plotter
Integrating this automated charting system into your daily trading workflow sets up highly reliable, rule-based execution parameters:
- The Pivot Bounce Setup: When price trends downward during the session and hits a major blue support line, monitor for a bullish candlestick pattern. A rejection of this automated boundary offers a low-drawdown long entry, with an initial target set at the central green pivot line.
- The Breakdown / Breakout Strategy: If price breaks forcefully through the central green pivot line and closes above or below it, it signals a strong shift in market sentiment. Traders can safely trade the momentum breakout toward the next red resistance or blue support level.
- Dynamic Take-Profit Anchoring: Avoid cutting profits short or holding trades too long by using the outer red and blue lines as mathematically backed profit targets.
Conclusion
The Auto Pivot Plotter MT4 indicator is an indispensable asset for structural market analysts. By providing automated, highly accurate support and resistance steps, it cleans up your technical workspace and ensures you execute trades at high-conspiracy institutional price zones.
5 Downloads
Last Update:
May 23, 2026 22:10 PM
Published:
Jan 15, 2026 21:15 PM
Category: