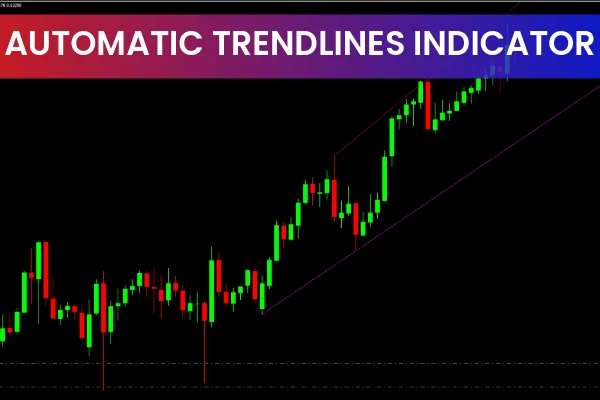
The Automatic Trendlines Indicator MT4 is a professional tool designed to automatically draw trend lines on your MetaTrader 4 chart. Utilizing Widner’s oscillator, this advanced indicator constructs trend lines accurately, eliminating manual errors and saving time for traders. Trend lines are a fundamental component of many trading strategies, and this tool ensures they are reliably identified and projected for future market movements.
How the Automatic Trendlines Indicator MT4 Works
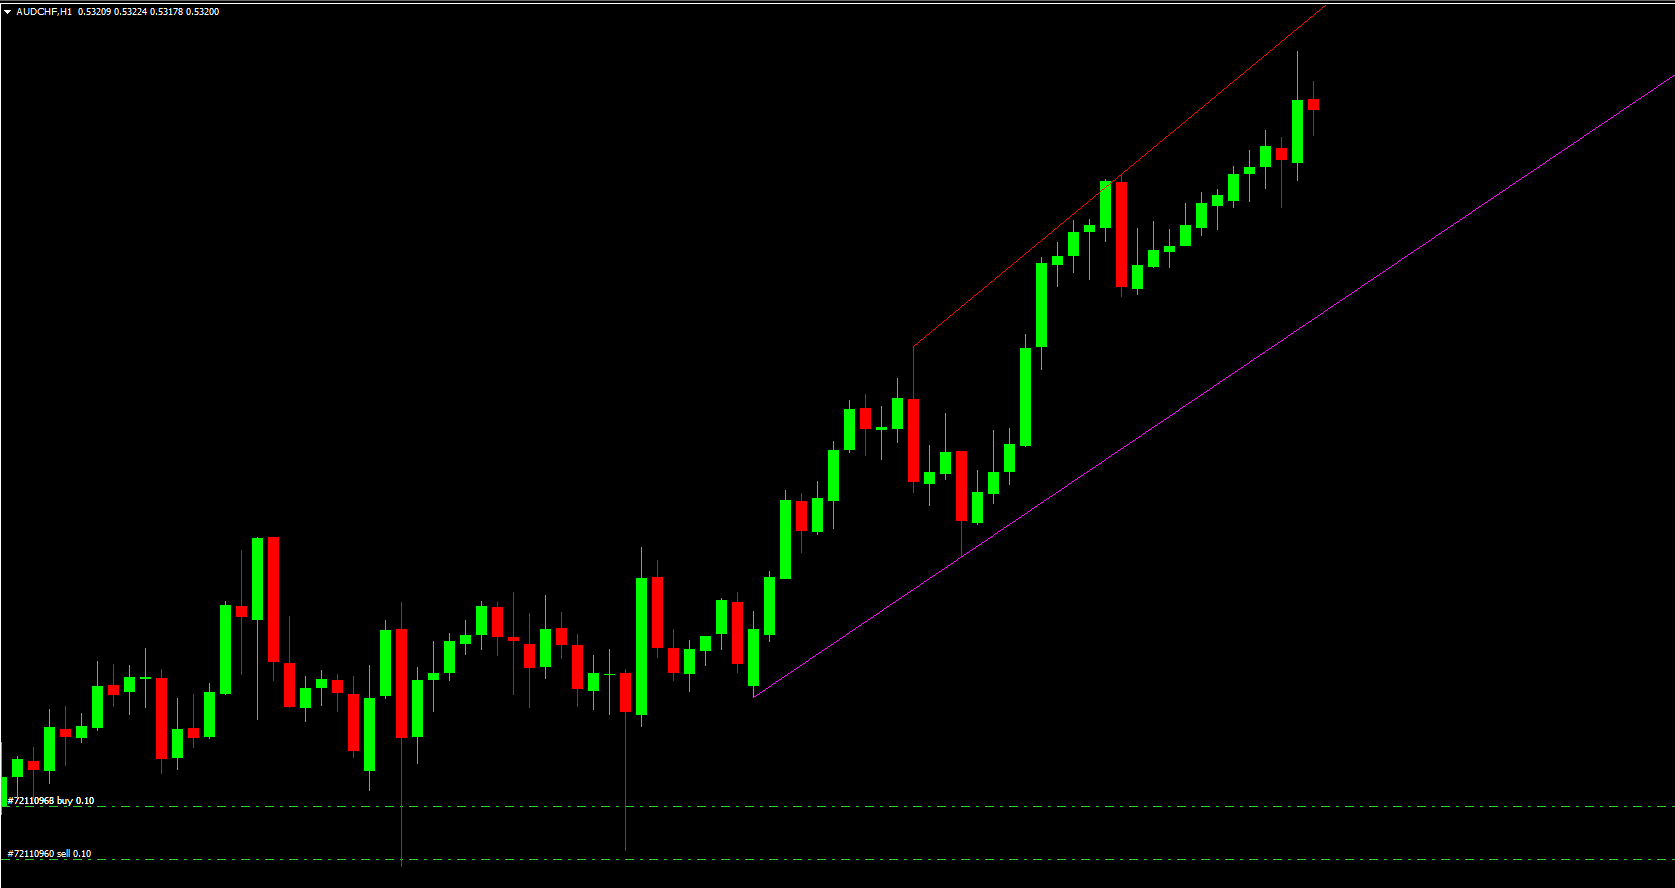
The indicator uses recent price data to draw trend lines and automatically deletes redundant lines. It also projects trend lines into the future, helping traders anticipate potential Support And Resistance levels. By visually highlighting these levels, the indicator provides traders with key points for entering or exiting trades and identifying reversals.
Key Features of the Automatic Trendlines Indicator MT4
Automated Trendline Drawing
The indicator automatically plots trend lines based on Widner’s oscillator, eliminating guesswork and ensuring precise support and resistance identification.
Future Trendline Projection
Trend lines are extended forward to forecast potential market movement, offering traders an advantage in predicting price reversals or breakouts.
Redundant Line Removal
The indicator keeps charts clean by automatically removing outdated or irrelevant trend lines, helping traders focus on current market structures.
Support for Multiple Strategies
The tool supports trendline breakout and trendline failure strategies, enabling traders to adapt to different market conditions effectively.
How to Trade Using the Automatic Trendlines Indicator MT4
Trendline Breakout Strategy
Breakouts indicate Trend Strength and the potential continuation of a movement:
Downtrend Break: Place a SELL order with stop above the previous high
Uptrend Break: Place a BUY order with stop below the previous low
Trendline Bounce (Failure) Strategy
Bounce-back trades occur when the price fails to break a trend line, signaling trend weakness:
Downtrend Bounce: Place a BUY order with stop below the trend line
Uptrend Bounce: Place a SELL order with stop above the previous high
By combining these strategies with the indicator, traders can capitalize on both breakout and bounce scenarios.
Benefits of Using the Automatic Trendlines Indicator MT4
Saves time by automating trend line drawing
Helps beginners learn trendline identification and trading strategies
Enhances accuracy for experienced traders by comparing manual trend lines
Supports Price Action-based trading for stronger analysis
Free to download and easy to integrate into MT4
This tool is invaluable for both novice and experienced traders who rely on trendlines, support, and resistance levels for strategic trading.
Conclusion
The Automatic Trendlines Indicator MT4 is an essential tool for traders looking to automate trendline analysis while maintaining accuracy. Its ability to draw, update, and project trend lines makes it perfect for trendline breakout, bounce-back, and support/resistance-based strategies. By combining this indicator with price action analysis, traders can maximize their trading efficiency and make informed decisions with confidence.
Visit IndicatorForest.com to download this free indicator and access other MT4 trading tools.
FAQ
3 Downloads
Published:
Dec 05, 2025 04:58 AM
Category: