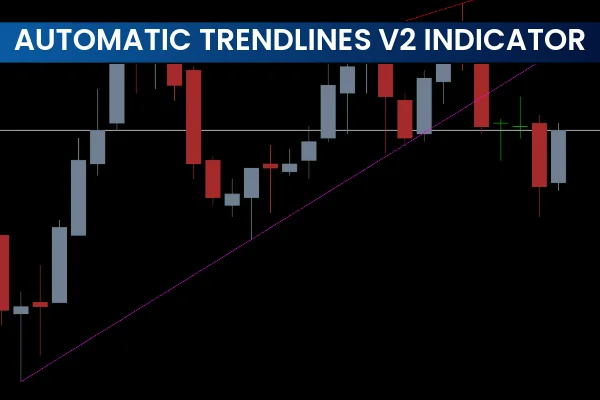
The Automatic Trendlines V2 Indicator MT4 is a powerful technical tool that automatically plots trendlines on your trading chart. Unlike manual trendline drawing, this indicator uses mathematical algorithms and historical price data to identify swing highs and lows and connect them with trendlines.
By visually displaying support and resistance levels, the indicator helps traders quickly detect overall market trends, whether bullish or bearish, improving trading accuracy and decision-making.
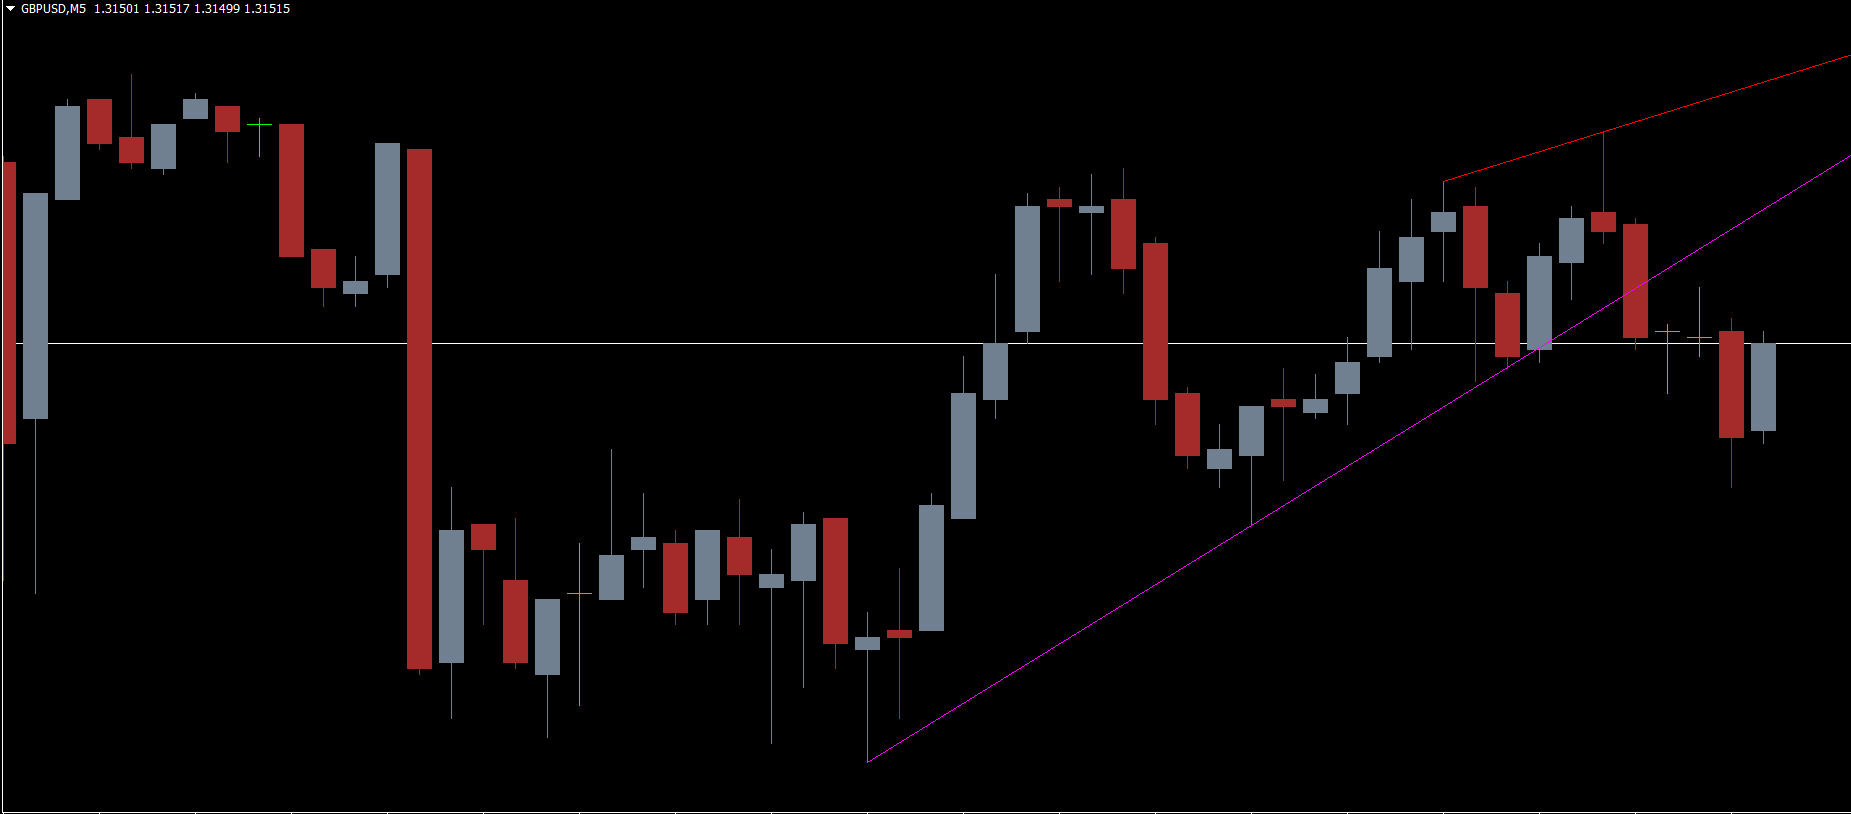
How the Automatic Trendlines V2 Indicator Works
The indicator identifies significant price swings and draws trendlines:
Red Bearish Line: Acts as resistance and indicates downward trends.
Magenta Bullish Line: Acts as support and indicates upward trends.
The slope of each trendline signals market direction:
Downward sloping red line: Bearish trend
Upward sloping magenta line: Bullish trend
Using these automatic trendlines, traders can quickly spot potential trend continuations or market reversals.
How to Use Automatic Trendlines V2 Indicator for Trading
Apply the indicator to any MT4 chart. Longer timeframes are recommended for better trend accuracy.
Observe the trendlines:
Red line sloping down → potential short opportunities
Magenta line sloping up → potential long opportunities
Combine with other indicators: For stronger signals, use Moving Averages, RSI, or MACD alongside the trendlines.
Identify Support And Resistance: Use the trendlines as dynamic levels for entering trades or placing stop-loss orders.
By using these trendlines, traders can plan entries, exits, and stop-loss placement effectively.
Advantages of the Automatic Trendlines V2 Indicator
Automatically plots trendlines, saving time
Highlights support and resistance visually
Works on all timeframes and currency pairs
Helps identify trend direction for better trading decisions
Can be combined with other technical tools for strategy enhancement
Limitations
Manual confirmation is recommended to avoid false trendlines in choppy markets
Best results occur on longer timeframes
Should be used alongside other technical indicators for more accurate trading
Conclusion
The Automatic Trendlines V2 Indicator for MT4 simplifies trendline analysis by automatically plotting bullish and bearish lines on your chart. These trendlines act as dynamic support and resistance levels, making it easier to identify market trends, continuations, and reversals. Incorporating this indicator into your trading strategy can save time, improve decision-making, and enhance overall trading performance.
Download the Automatic Trendlines V2 Indicator MT4 today and start detecting market trends with ease at IndicatorForest.com.
FAQ
3 Downloads
Published:
Nov 17, 2025 22:36 PM
Category: