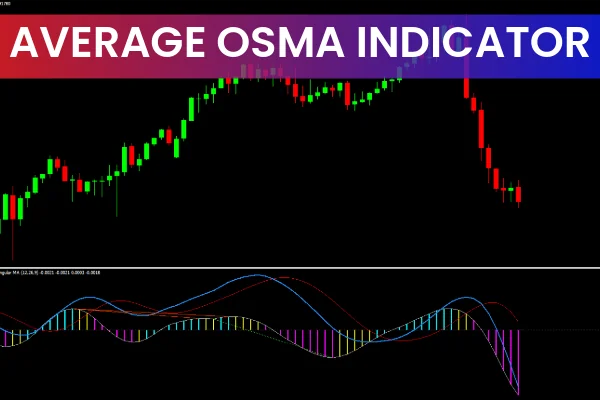
The Average OSMA indicator for MT4 is a versatile forex trading tool that provides buy and sell signals based on the 0 line crossover of the OSMA (Oscillator of a Moving Average). It calculates OSMA using various moving average methods and displays Trend Strength via a histogram for better trading decisions. Additionally, the indicator identifies bullish and bearish divergences on both the price chart and the indicator window.
Key Features of the Average OSMA Indicator
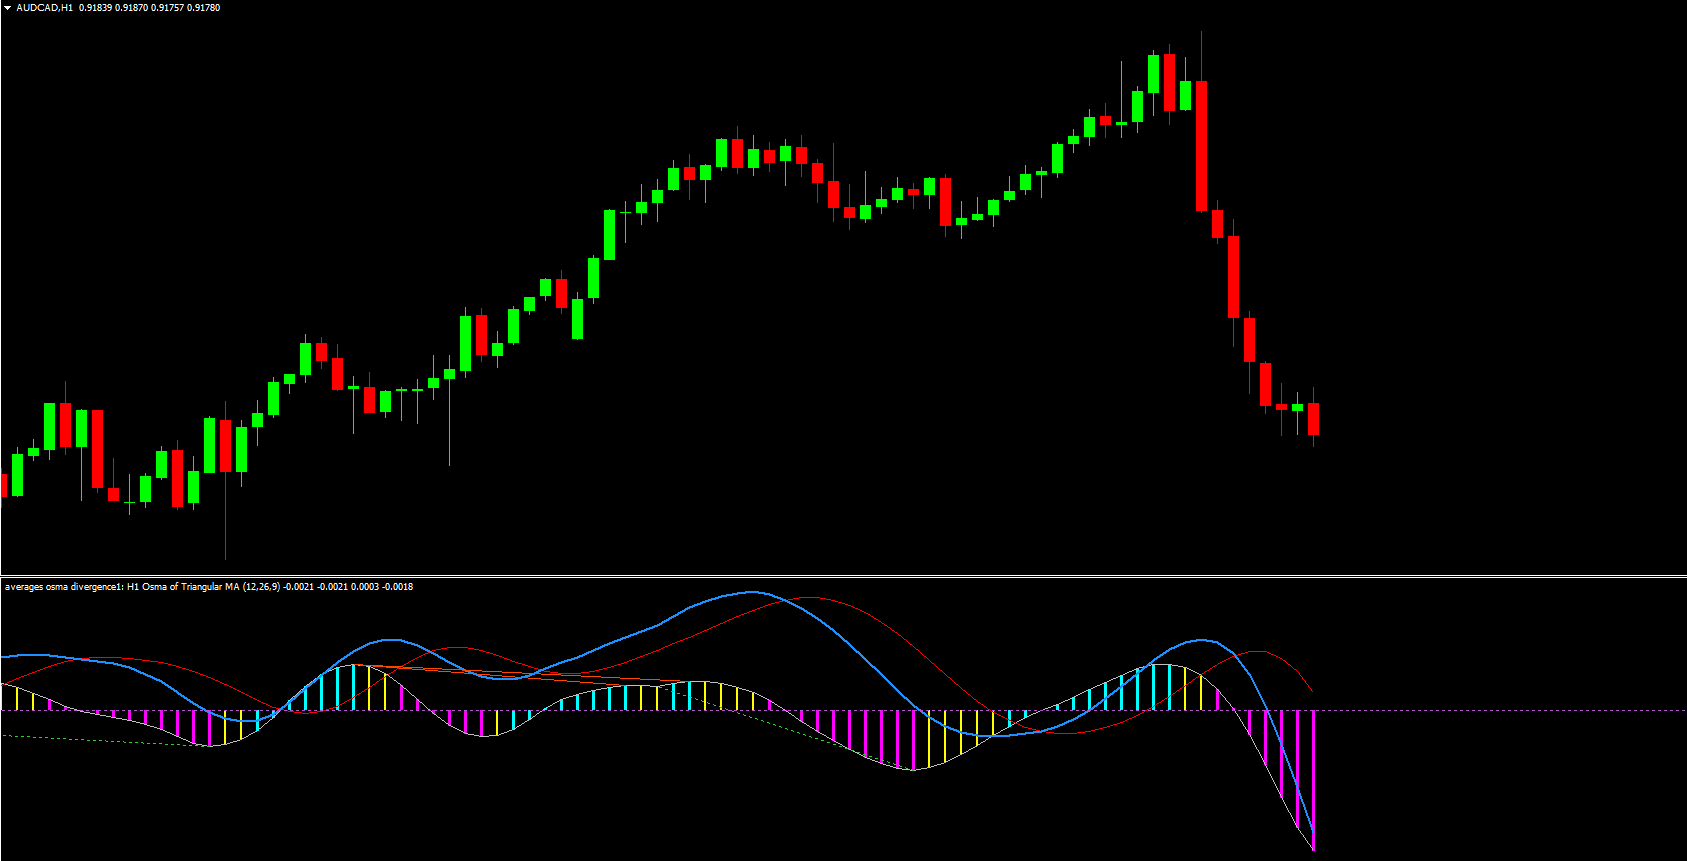
Histogram Analysis – Bullish bars in aqua, bearish bars in magenta, and neutral bars in silver help traders visualize market momentum.
Indicator Lines – Red and blue lines show trend direction; a blue line crossing above red signals a bullish market.
Divergence Detection – Bullish divergences are shown in green and bearish divergences in red, providing early Trend Reversal alerts.
Versatile Timeframes – Works on all intraday chart timeframes and supports different trading strategies, from Scalping to swing trading.
How to Trade with the Average OSMA Indicator
Using Histogram Crossovers – Consider buying when the histogram crosses above the 0 line, placing a stop-loss below the previous swing low. Sell when the histogram crosses below 0 with a stop-loss above the previous swing high.
Monitoring Divergences – Use the divergence signals for early indications of potential trend reversals.
Crossover Signals – Blue crossing above red indicates bullish momentum; red crossing above blue indicates bearish momentum. These signals may be less reliable if used alone.
Exit Strategy – Since the indicator does not provide take profit levels, traders should exit at the opposite signal or apply a good risk-to-reward strategy.
The Average OSMA indicator is ideal for traders seeking both trend direction and momentum analysis in one tool.
Conclusion
The Average OSMA indicator for MT4 provides comprehensive analysis of market momentum, including trend strength, histogram analysis, and divergence detection. Its combination of multiple OSMA analysis methods makes it a valuable tool for both novice and experienced forex traders.
FAQ
4 Downloads
Published:
Dec 07, 2025 10:36 AM
Category: