Trading with Precision: Mastering the Bank Levels Indicator
In the world of institutional trading, the markets do not move randomly. While retail traders often focus on lagging indicators and complex patterns, large financial institutions—banks, hedge funds, and market makers—operate around specific price zones where massive liquidity is clustered. The Bank Levels Indicator for MetaTrader is a professional-grade tool designed to bridge the gap between retail analysis and institutional order flow by automatically identifying these high-conviction "smart money" zones on your chart.
What are Bank Levels?
Bank Levels are horizontal price zones where significant institutional buying or selling activity has historically occurred or is expected to occur. Unlike standard pivot points that rely on simple mathematical averages, Bank Levels are derived from market structure and liquidity pools. These levels represent the "true" Support And Resistance of the market.
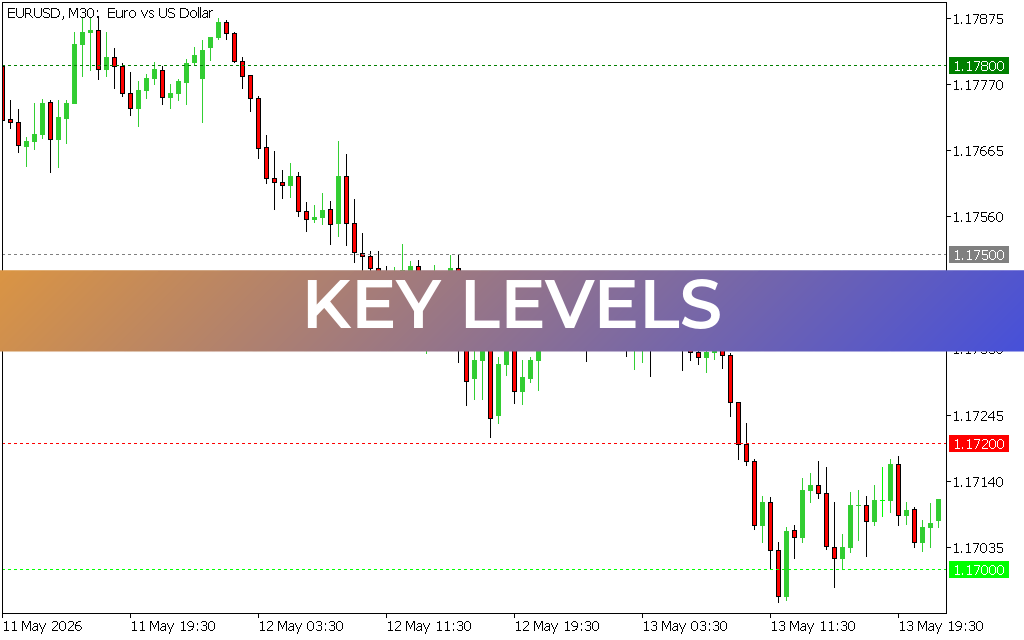
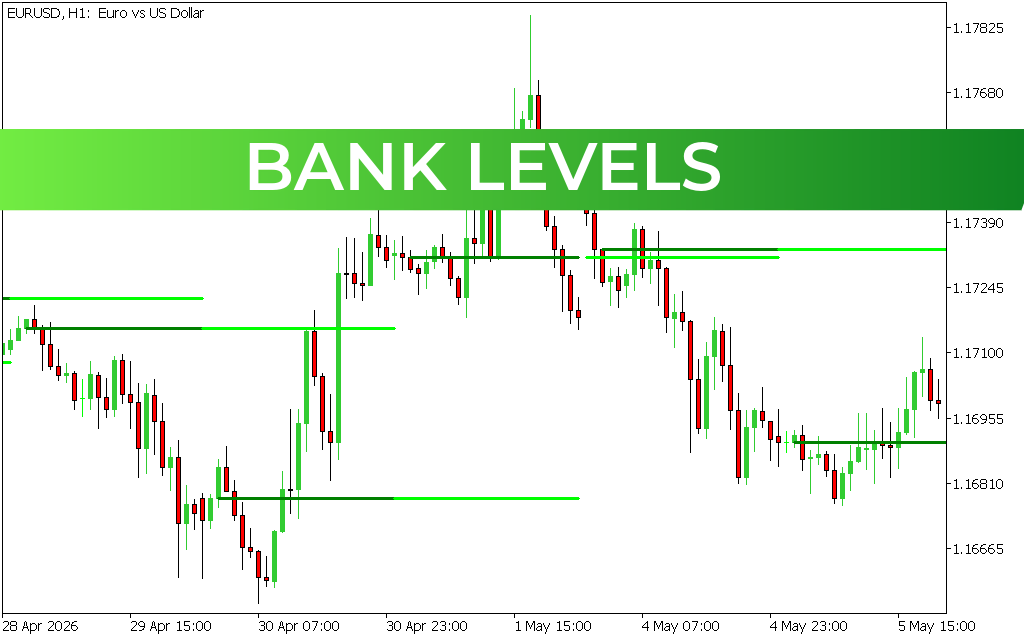
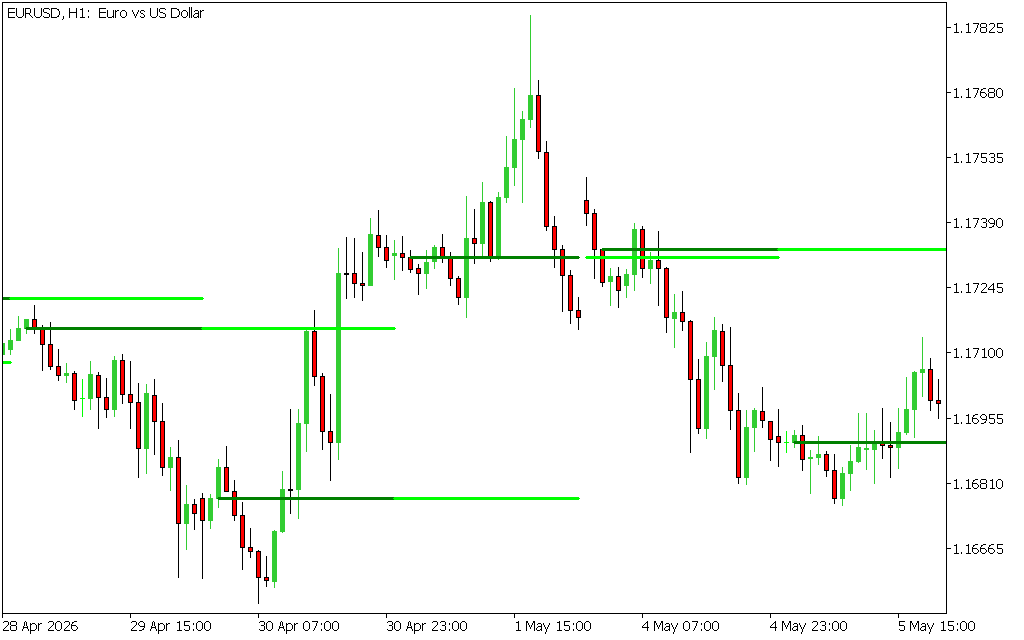
As seen in the EUR/USD H1 chart, the indicator plots thick green horizontal lines across the screen. These are not just random lines; they are psychological and structural barriers where the market has shown a tendency to stall, reverse, or consolidate. When price approaches a Bank Level, it is entering a zone where institutional "limit orders" are likely waiting to be filled.
Key Features and Strategic Advantages
- Objective Market Structure: The Bank Levels Indicator removes the subjectivity of drawing support and resistance. It provides a consistent, rule-based framework that looks exactly the same on every trader's screen, mirroring how institutional desks view the market.
- High-Probability Reversal Zones: These levels act as "walls" for Price Action. In a ranging market, price will often bounce between two Bank Levels with surgical precision. For a day trader, this provides clear entry points with defined risk.
- Institutional Breakout Confirmation: When the price finally breaks through a long-standing Bank Level with high volume, it signals a major shift in market sentiment. These "institutional breakouts" often lead to sustained trends, providing excellent opportunities for swing traders.
- Clean Visual Interface: The indicator is designed to be non-intrusive. By focusing on essential horizontal zones, it keeps your charts clean and allows you to focus on price action and Candlestick Patterns at critical junctions.
Strategic Application: The "Touch and Reject"
The most common way to trade with the Bank Levels Indicator is the "Touch and Reject" strategy. On the 1-hour timeframe (H1), traders wait for the price to move toward a green Bank Level. If the price touches the level and forms a reversal candlestick—such as a pin bar or an engulfing pattern—it confirms that the institutional "supply" or "demand" at that level is holding.
In the provided EUR/USD example, notice how the price respects the green levels multiple times before finally breaking through to the next zone. Each touch of the level provides a low-risk entry point, where a Stop Loss can be placed just on the other side of the line, offering an exceptional reward-to-risk ratio.
Conclusion
The Bank Levels Indicator is a powerful asset for any trader looking to align their strategy with the "smart money." By identifying the zones where banks are actually trading, you move away from retail guesswork and toward institutional-grade precision. Download it today to start seeing the market through the lens of institutional liquidity.
6 Downloads
Last Update:
May 14, 2026 01:46 AM
Published:
Jan 22, 2026 18:36 PM
Category: