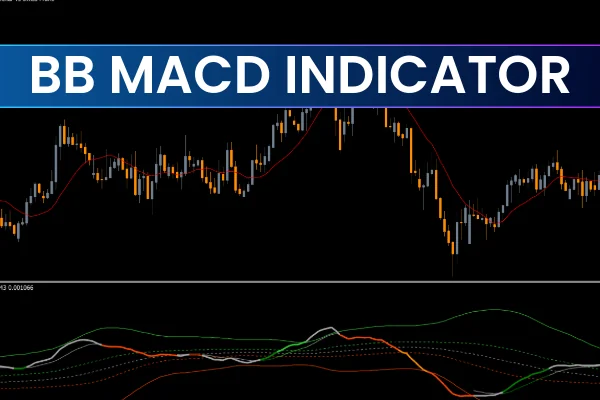
The BB MACD Indicator for MT5 is a unique technical tool that combines the classic MACD with Bollinger Bands. This fusion allows traders to analyze market volatility on the MACD line, providing additional insights for entry and exit points.
Unlike traditional price-based Bollinger Bands, the BB MACD focuses on MACD volatility, offering a fresh perspective on Trend Strength and potential reversals. Beginner traders should familiarize themselves with classic Bollinger Bands before using this indicator, while advanced traders can exploit its volatility-based signals.
This indicator works on all chart timeframes, is non-repainting, and can be applied to Forex, commodities, and indices. Download it free at IndicatorForest.com to enhance your MT5 trading setup.
How the BB MACD Indicator Works
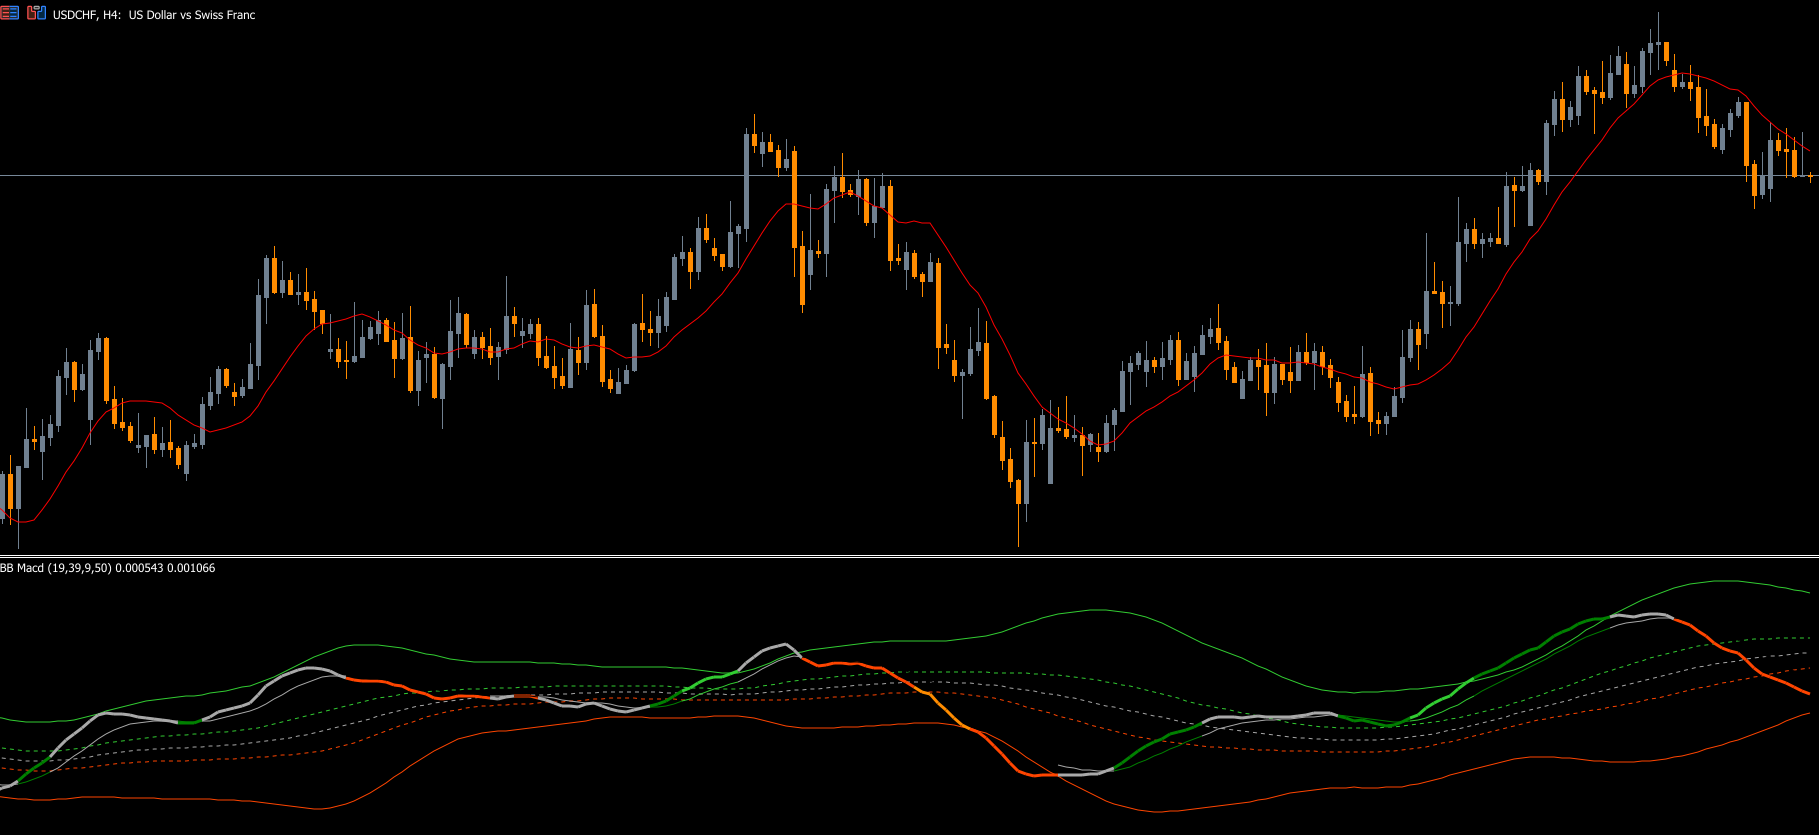
The BB MACD Indicator plots:
MACD Line – shows market trend and momentum.
Bollinger Bands – envelop the MACD line to indicate volatility.
Color signals:
Blue MACD Line – indicates an uptrend, suggesting buy opportunities.
Red MACD Line – indicates a downtrend, suggesting sell opportunities.
Traders can approach signals in two ways:
Basic Trend Signal: Buy when the MACD line turns blue and sell when it turns red.
Volatility Breakout Strategy: Use the Bollinger Bands around the MACD line.
Enter BUY when the MACD line crosses above the upper band (uptrend confirmation).
Enter SELL when the MACD line crosses below the lower band (downtrend confirmation).
Because the MACD bands are narrow, signals can be frequent, making volatility breakout entries more selective and precise.
BB MACD Indicator Trading Strategies
Trend Following Approach:
Use the MACD line color as the primary trend signal.
Confirm trend direction with higher timeframe charts.
Volatility-Based Entries:
Wait for the MACD line to cross Bollinger Bands for stronger breakout signals.
Apply stop-loss near the opposite band to manage risk.
Combining With Other Indicators:
Pair with moving averages to filter false signals.
Use Support And Resistance levels to identify profit-taking points.
Optional: Combine with the XTSR or Ultra Trend Ver2 Indicator for multi-indicator confirmation.
Advantages of the BB MACD Indicator for MT5
Volatility-Based Trading – Focuses on MACD fluctuations rather than price alone.
Multiple Trading Strategies – Trend-following or breakout-based approaches.
All Timeframe Compatible – Works on M1 to D1 charts.
Non-Repainting Indicator – Provides reliable signals without recalculation.
Beginner-Friendly & Advanced Friendly – Easy to read yet powerful for sophisticated strategies.
This combination of trend detection and volatility analysis makes the BB MACD a versatile tool for short-term and long-term traders alike.
Conclusion
The BB MACD Indicator for MT5 provides traders with a unique perspective on market trends, focusing on MACD volatility rather than price movements alone. It allows traders to spot trend changes, breakouts, and potential reversal points more effectively.
While beginners can rely on the basic MACD color signals, advanced traders can apply volatility breakout strategies for more selective entries. Always combine with proper risk management and other indicators for optimal results.
👉 Download the BB MACD Indicator for MT5 for free at IndicatorForest.com and start trading volatility-based signals today!
FAQ
7 Downloads
Published:
Nov 10, 2025 14:48 PM
Category: