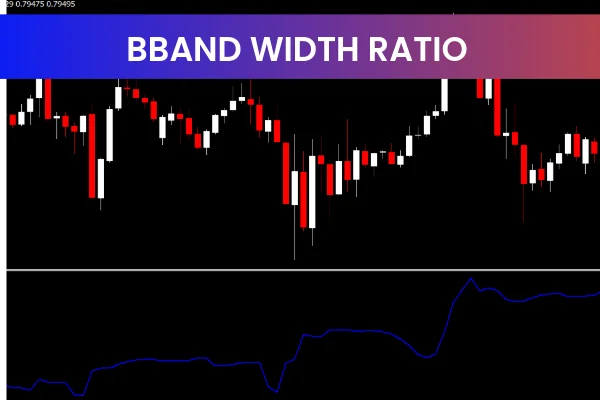
The BBand Width Ratio Indicator is a popular and free Forex trading tool for the MetaTrader 4 platform. It is based on the well-known Bollinger Bands concept and is designed to help traders analyze market volatility, identify overbought and oversold conditions, and spot potential trend reversals
By focusing on the width of Bollinger Bands rather than price alone, the BBand Width Ratio Indicator gives traders deeper insight into market behavior and helps them anticipate upcoming price movements.
What Is the BBand Width Ratio Indicator
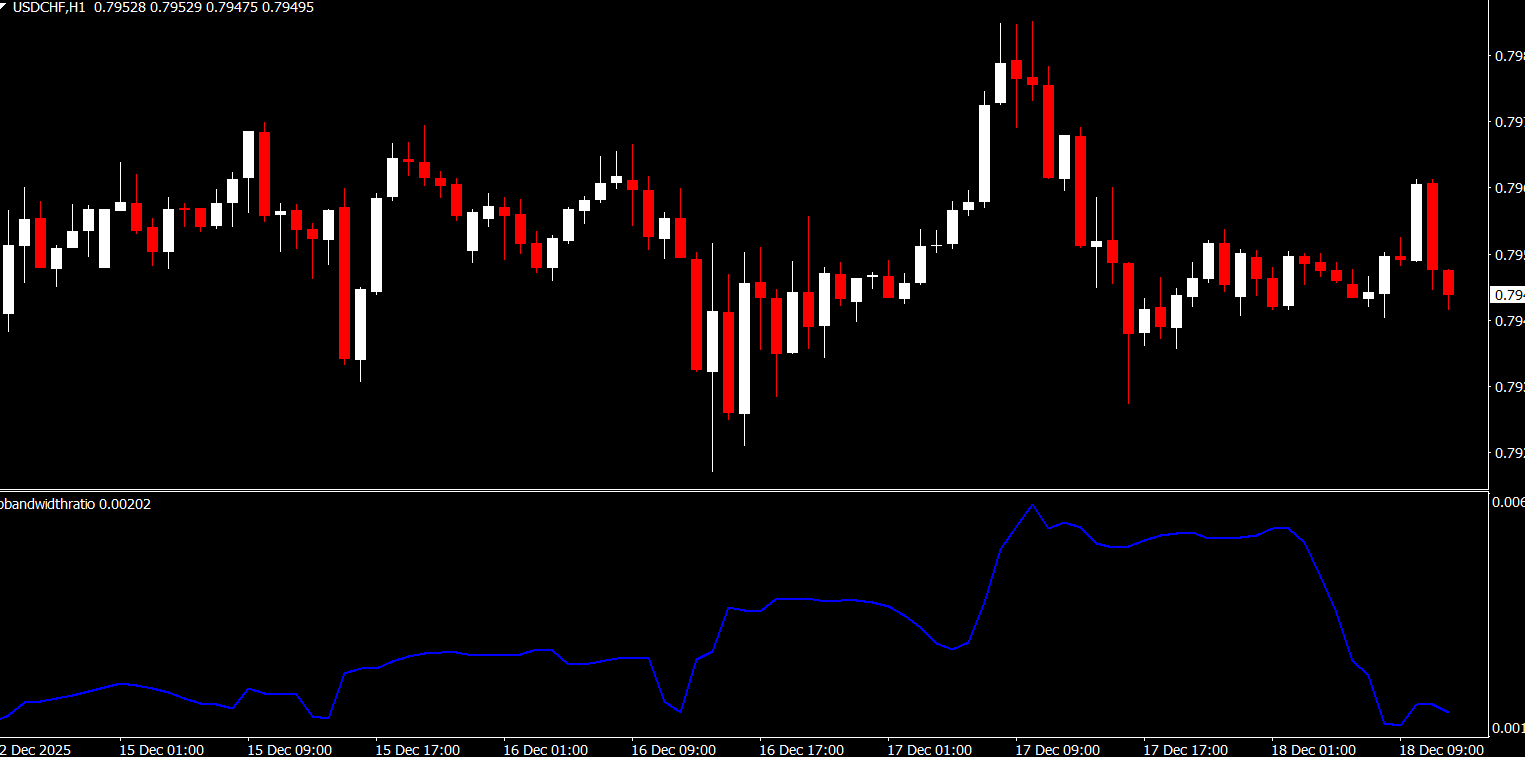
The BBand Width Ratio Indicator measures the distance between the upper and lower Bollinger Bands and converts this distance into a ratio. This ratio reflects how volatile the market is at any given time.
The indicator plots:
A ratio line that represents the current Bollinger Band width
An average line that smooths the ratio for clearer analysis
This approach allows traders to see whether volatility is expanding or contracting, which often precedes significant price movements.
How the BBand Width Ratio Indicator Works
Once added to an MT4 chart, the indicator continuously analyzes Bollinger Band width and displays the results visually.
Key interpretations include:
When the ratio line is above 1, the market is considered overbought or highly volatile
When the ratio line is below 1, the market is considered oversold or low volatility
Crossovers between the ratio line and its average can signal changes in market conditions
These signals help traders decide when to enter or exit trades with better timing.
Identifying Overbought and Oversold Conditions
The BBand Width Ratio Indicator is especially useful for spotting extreme market conditions:
High ratio values suggest strong price expansion and potential exhaustion
Low ratio values indicate tight price ranges and possible upcoming breakouts
Sudden increases in the ratio often precede strong trending moves
This makes the indicator valuable for both breakout traders and reversal traders.
Volatility, Support, and Resistance Analysis
In addition to momentum signals, the indicator also helps traders:
Identify periods of low volatility before major price moves
Anticipate Support And Resistance zones formed during volatility expansion
Confirm trend reversals when volatility shifts direction
By combining volatility data with Price Action, traders gain a clearer market perspective.
Ease of Use and Customization
The BBand Width Ratio Indicator is simple to use and suitable for all experience levels. Traders can:
Adjust Bollinger Band parameters
Modify the averaging period of the ratio
Customize colors and visual settings
Apply the indicator to any timeframe or currency pair
These options allow traders to tailor the indicator to their preferred trading style.
Advantages of the BBand Width Ratio Indicator
Forex traders value this indicator for several reasons:
Provides clear insight into market level volatility
Helps identify overbought and oversold conditions
Supports Trend Reversal and breakout strategies
Easy to read and interpret
Free and fully compatible with MT4
It is a powerful addition to any technical analysis toolkit.
Best Trading Strategies to Combine With It
The BBand Width Ratio Indicator works well when combined with:
RSI for momentum confirmation
Moving averages for trend direction
Support and resistance analysis
Price action patterns such as breakouts and consolidations
Using multiple confirmations can significantly improve trade accuracy.
Conclusion and Call to Action
The BBand Width Ratio Indicator is a free and effective MT4 Forex tool that helps traders understand volatility, identify overbought and oversold conditions, and anticipate potential trend reversals. Its Bollinger Band–based approach makes it an invaluable resource for smarter trading decisions.
To download this indicator and explore more free MT4 Forex tools and professional trading guides, visit IndicatorForest.com and enhance your trading performance today.
FAQ
BBand Width Ratio measures the distance between the upper and lower Bollinger Bands and converts this distance into a ratio. This ratio reflects market volatility at any given time, helping traders see whether volatility is expanding or contracting, which often precedes significant price movements.
When the ratio line is above 1, the market is considered overbought or highly volatile. When the ratio line is below 1, the market is considered oversold or low volatility. Crossovers between the ratio line and its average can signal changes in market conditions.
High ratio values suggest strong price expansion and potential exhaustion, while low ratio values indicate tight price ranges and possible upcoming breakouts. Sudden increases in the ratio often precede strong trending moves, making it valuable for both breakout and reversal traders.
Yes, the indicator helps identify periods of low volatility before major price moves, anticipate support and resistance zones formed during volatility expansion, and confirm trend reversals when volatility shifts direction. Combining volatility data with price action provides clearer market perspective.
Combine it with RSI for momentum confirmation, moving averages for trend direction, support and resistance analysis, and price action patterns such as breakouts and consolidations. Using multiple confirmations can significantly improve trade accuracy.
1 Download
Published:
Dec 18, 2025 06:38 AM
Category: