The Average Daily Range Indicator measures the average price movement (in pips or points) of a trading pair over a selected period — typically 5, 10, or 20 days.
It calculates the difference between the daily high and low, then averages this range across the specified number of days. The result is a reliable measure of market volatility and expected movement.
In technical terms, the indicator’s logic is based on the Average True Range (ATR) of the daily timeframe. For example:
The 20-day ADR equals the 20-day ATR on the daily chart.
The 10-day and 5-day ADRs represent shorter-term volatility averages.
Using this data, the ADR indicator projects the upper and lower price levels for the current day:
Top of the range = Low of the current day + 5-day ADR
Bottom of the range = High of the current day – 5-day ADR
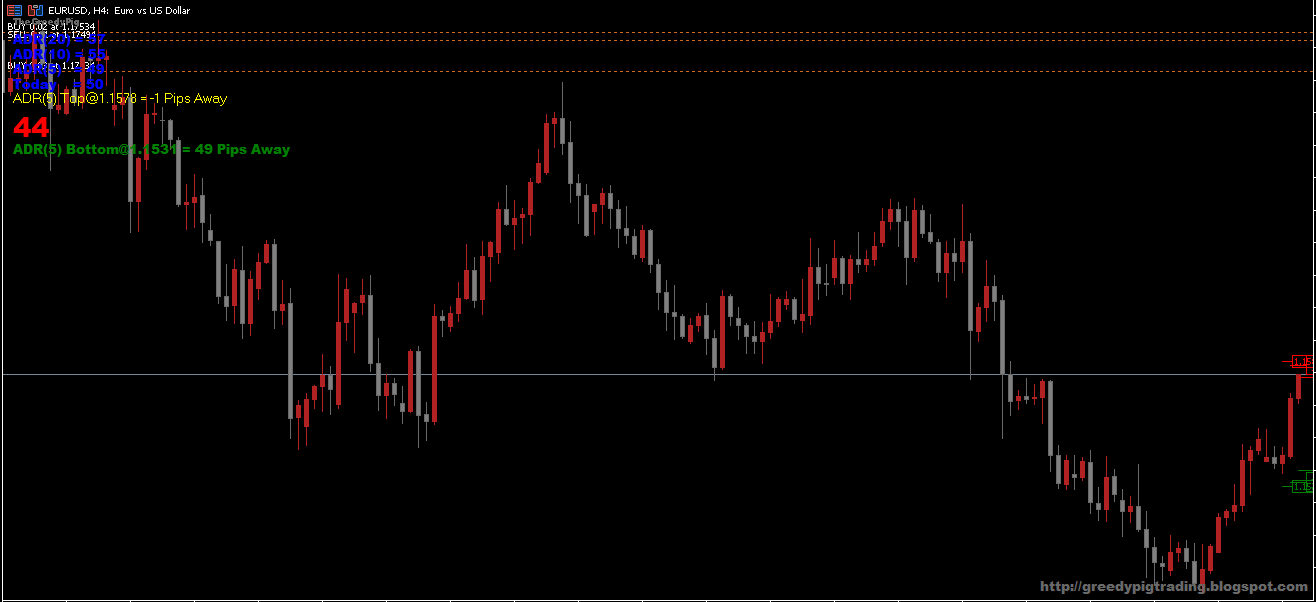
It also displays the distance (in pips) between the current price and these projected levels, allowing traders to judge whether their profit targets are realistic. Additionally, the indicator highlights whether current movement is positive (bullish) or negative (bearish), typically displayed in the upper-left corner of the MT5 chart.
How to Trade Using the ADR Indicator
The ADR indicator for MT5 doesn’t generate direct buy or sell signals — instead, it serves as a planning and validation tool. It helps traders confirm whether there is enough room in the market for a trade to reach its target.
Long Position Setup
Open a buy trade when your target profit lies within the projected top of the ADR range.
Set the take profit just below the projected top to ensure a realistic exit point.
Place your stop loss slightly below the recent swing low for risk protection.
Short Position Setup
Enter a sell trade when your take profit level is above the projected bottom of the range.
Place the take profit slightly above the projected low.
Set your stop loss just above the latest swing high.
By following this method, traders can avoid placing trades that aim for unrealistic profit levels when the daily price range has already been reached.
Chart Example
On the EUR/USD H1 chart, the ADR indicator may show:
20-day ADR = 51 pips
10-day ADR = 53 pips
5-day ADR = 59 pips
If the current daily range is 6 pips, the indicator might reveal that the price is 56 pips away from the projected top and 56 pips away from the projected bottom.
This gives traders a clear sense of how much room remains for the market to move within its typical daily range — ideal for setting take profit and stop loss zones with precision.
Advantages of the ADR Indicator MT5
Helps traders set realistic profit targets.
Improves risk-to-reward ratio assessment.
Works well for day trading and intraday strategies.
Provides insight into daily volatility and price potential.
Can be combined with trend or reversal indicators for stronger setups.
Conclusion
The ADR Indicator for MT5 is an invaluable tool for traders who want to plan their trades intelligently. It doesn’t generate trading signals on its own, but it provides a deeper understanding of daily price volatility and helps you determine whether your take profit target is achievable within the day’s range.
For best results, combine the ADR with Price Action, trend indicators, or momentum tools like the MACD or RSI to confirm entry signals. With proper use, this indicator can greatly enhance your trade planning and overall profitability.
FAQ
10 Downloads
Published:
Nov 07, 2025 10:05 AM
Category: