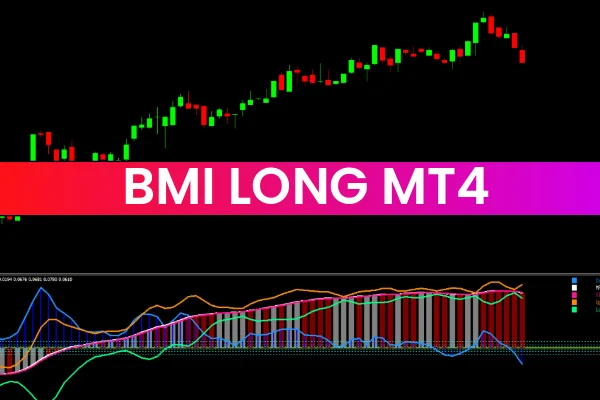
The BMI Long Indicator for MT4 is a powerful forex trading tool that integrates several well-known technical indicators—OSMA, MACD, Bollinger Bands, and Stochastic Oscillator—into one cohesive system. By combining these analytical tools, the indicator helps traders identify bullish and bearish trends with greater accuracy.
Whether you’re a beginner seeking confirmation signals or an advanced trader refining entry and exit strategies, the BMI Long Indicator offers valuable insights into trend direction, momentum, and market volatility. You can download and explore it today on IndicatorForest.com.
How the BMI Long Indicator Works
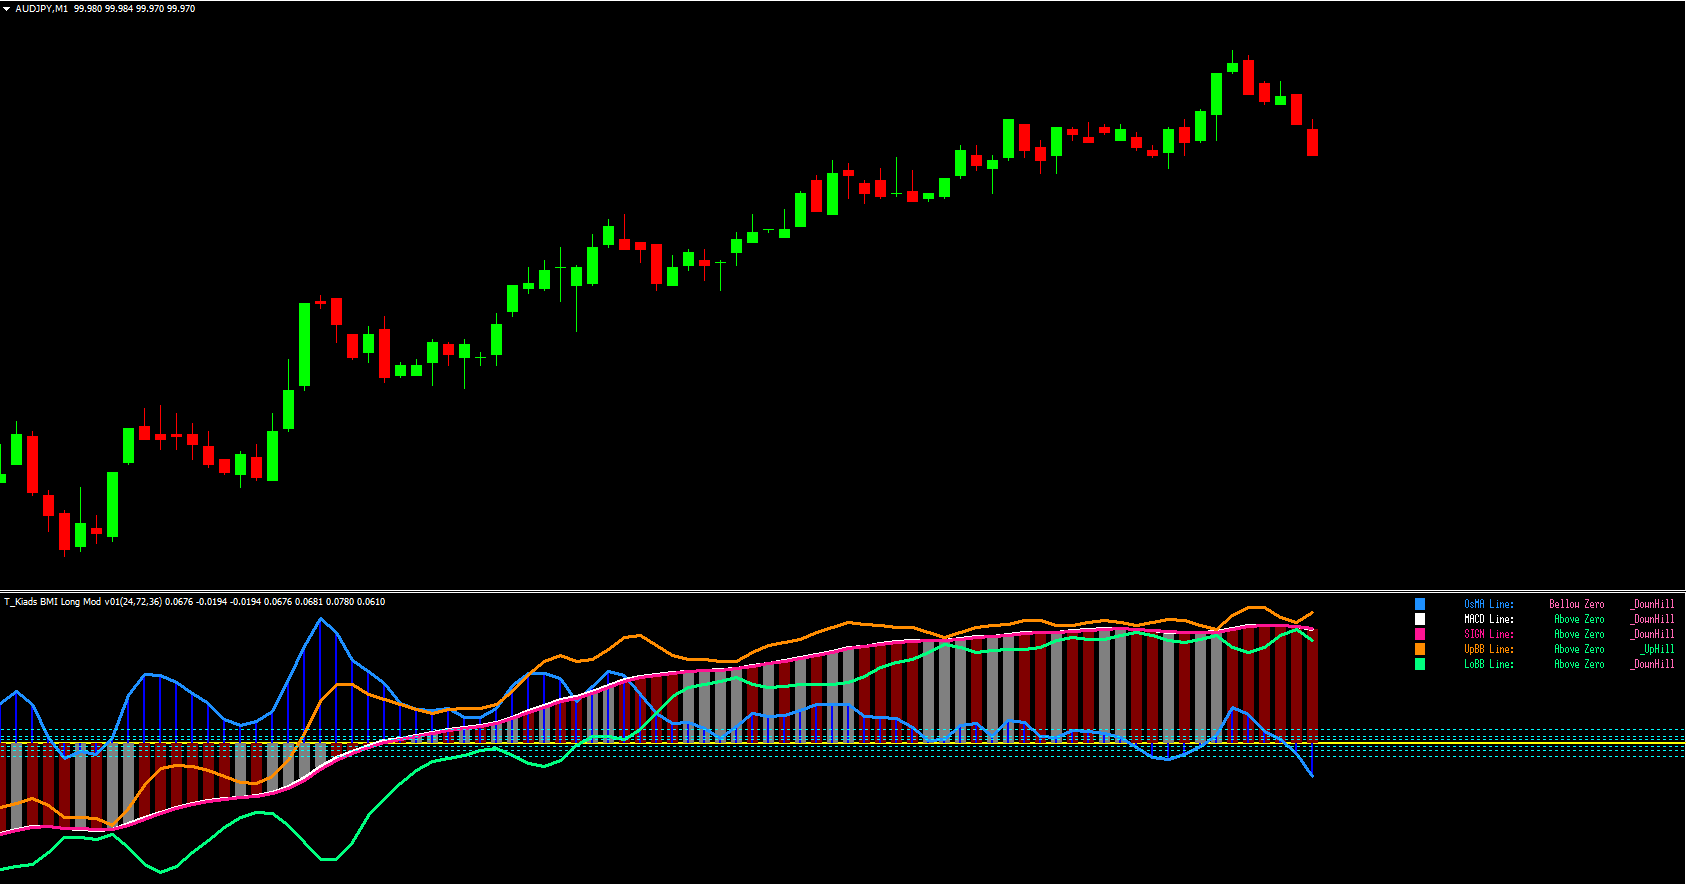
The indicator displays multiple visual components on your MetaTrader 4 (MT4) chart:
OSMA Line (Blue): Represents momentum and helps confirm Trend Strength.
MACD Line (White): Measures convergence and divergence between moving averages.
Signal Line (Pink): Provides cross-over trading signals.
Bollinger Bands: The upper band (orange) and lower band (green) show price volatility.
Zero Line (Yellow): Acts as a neutral reference point for bullish or bearish signals.
When the pink signal line crosses above the zero line, it indicates a bullish signal—suggesting potential upward price movement. Conversely, if it crosses below the zero line while the OSMA and MACD lines are also below zero, this signals a bearish trend.
How to Interpret the BMI Long Indicator Signals
The BMI Long Indicator simplifies complex analysis by visually showing momentum shifts:
Bullish Scenario:
Signal line crosses above zero.
OSMA and MACD are rising and remain above zero.
Price often stays near or above the upper Bollinger Band.
Bearish Scenario:
Signal line drops below zero.
OSMA and MACD are falling and remain below zero.
Price often moves close to or under the lower Bollinger Band.
Although the BMI Long Indicator offers clear signals, it does not include stop-loss or take-profit levels. Traders should manually determine exit points based on opposite signals or by applying a risk-reward ratio that fits their strategy.
Why Traders Use the BMI Long Indicator
Multi-Indicator Confirmation: It merges four proven indicators for enhanced reliability.
Trend Identification: Clearly highlights both short-term and long-term trends.
Ease of Use: Simple visual display suitable for all MT4 users.
Compatibility: Works seamlessly on all intraday timeframes, from M1 to H4 charts.
Accuracy: Reduces false signals by relying on multiple confirmation factors.
Using this indicator can significantly improve your technical analysis and decision-making, especially when combined with disciplined money management.
Best Practices for Using the BMI Long Indicator
Always confirm the signal with Price Action or support/resistance analysis.
Avoid trading during low volatility sessions.
Combine it with volume indicators for stronger confirmation.
Backtest the indicator on historical data before live trading.
These practices ensure that you use the BMI Long Indicator effectively, minimizing risk and enhancing your success rate.
Conclusion
In summary, the BMI Long Indicator for MT4 provides traders with a comprehensive trend-following system that merges the strengths of OSMA, MACD, Bollinger Bands, and Stochastic indicators. By offering clear bullish and bearish trading signals, it helps you make smarter, data-driven trading decisions.
Discover more powerful MT4 and MT5 tools like the BMI Long Indicator at IndicatorForest.com—your go-to source for high-quality forex indicators.
FAQ
Published:
Dec 18, 2025 13:25 PM
Category: