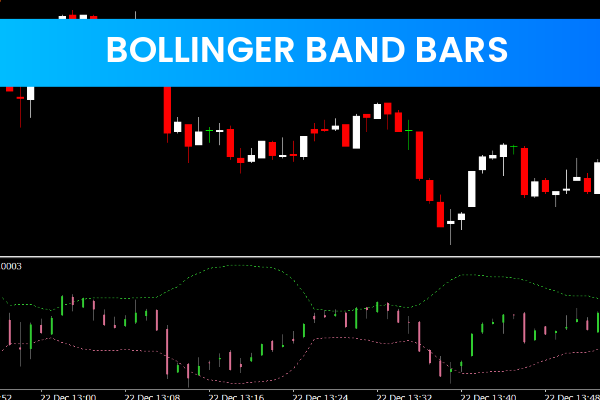
The Bollinger Band Bars Forex Indicator MT4 is a popular and free trading tool designed to help Forex traders analyze market volatility, trend direction, and momentum with clarity. Built specifically for the MetaTrader 4 platform, this indicator offers visual signals that simplify decision-making for both beginner and experienced traders.
By using Bollinger Bands combined with a histogram display, the indicator helps traders quickly identify potential entry and exit points, Trend Continuation, and possible market reversals.
What Is the Bollinger Band Bars Forex Indicator MT4
The Bollinger Band Bars Forex Indicator MT4 is based on the classic Bollinger Bands concept, which measures price volatility relative to a moving average. It plots upper and lower bands around Price Action and displays a histogram that reflects the strength of the current trend.
When price approaches or breaks through the bands, traders are alerted to possible breakout opportunities or overextended market conditions.
How the Bollinger Band Bars Forex Indicator MT4 Works
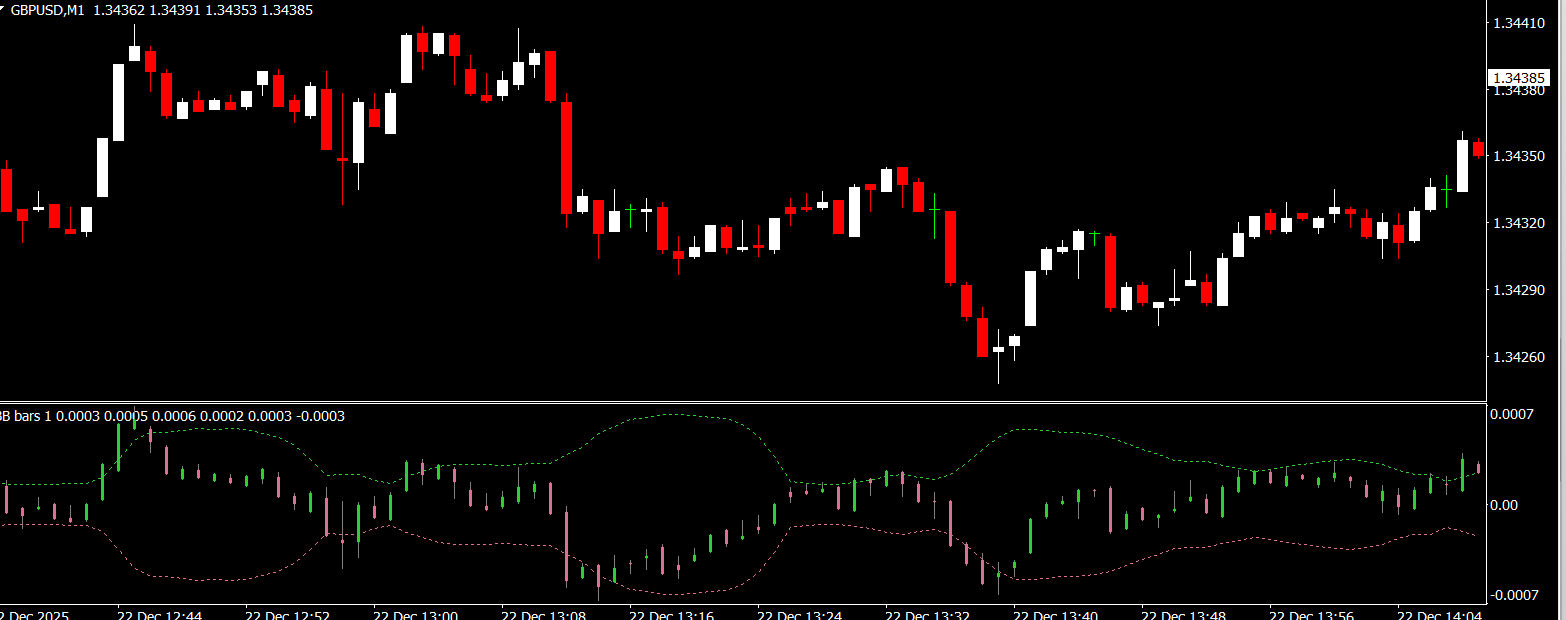
The indicator plots:
An upper Bollinger Band (resistance level)
A lower Bollinger Band (support level)
A histogram showing Trend Strength and momentum
When price breaks above the upper band, it may signal strong bullish momentum or a breakout.
When price breaks below the lower band, it may signal strong bearish momentum.
The histogram helps traders determine whether the trend is strengthening, weakening, or potentially reversing.
Key Features of Bollinger Band Bars Forex Indicator MT4
Bollinger Band–based volatility analysis
Histogram showing trend strength
Identifies potential buy and sell zones
Helps spot breakouts and reversals
Works on all MT4 timeframes
Compatible with all currency pairs
Simple and beginner-friendly
Free to download and use
How to Use Bollinger Band Bars Forex Indicator MT4
Buy Setup
When price moves near or breaks above the upper band and the histogram shows increasing strength, traders may look for bullish continuation opportunities.
Sell Setup
When price approaches or breaks below the lower band with strong histogram confirmation, bearish trade setups may appear.
Reversal Identification
If price touches a band but the histogram weakens, it may signal trend exhaustion and a possible reversal.
Best Indicator Combinations
For improved accuracy, the Bollinger Band Bars Forex Indicator MT4 can be combined with:
RSI for overbought and oversold confirmation
Moving averages for trend direction
Price action patterns
Support And Resistance levels
Using confirmation helps reduce false signals and improves trade quality.
Benefits of Using Bollinger Band Bars Forex Indicator MT4
Helps traders understand market volatility
Identifies strong trends and momentum shifts
Improves entry and exit timing
Reduces emotional trading decisions
Works well in trending and ranging markets
Its versatility makes it suitable for multiple trading styles.
Who Should Use This Indicator
The Bollinger Band Bars Forex Indicator MT4 is ideal for:
Day traders and swing traders
Volatility-based strategy traders
Breakout traders
Beginners learning trend and momentum analysis
It adapts easily to different market conditions.
Final Thoughts
The Bollinger Band Bars Forex Indicator MT4 is a powerful yet simple volatility tool that helps traders identify trends, momentum, and potential breakouts. By combining Bollinger Bands with a trend-strength histogram, it delivers clear and actionable market insights.
If you are looking for a free MT4 indicator to improve your timing and understand price volatility more effectively, the Bollinger Band Bars Forex Indicator MT4 is an excellent addition to your trading toolkit. Visit IndicatorForest.com to download this indicator and explore more professional Forex trading tools.
FAQ
Published:
Dec 22, 2025 08:12 AM
Category: