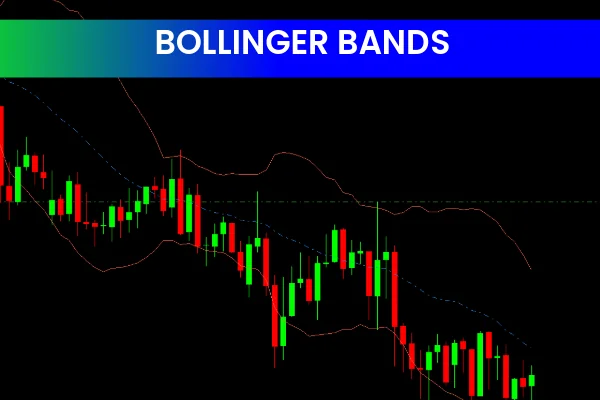
The Bollinger Bands indicator is a widely used and free Forex trading tool available for the MetaTrader 4 (MT4) platform. It is a versatile technical indicator that helps traders measure market volatility, identify trends, and determine potential buy and sell zones.
How the Bollinger Bands Indicator Works
The Bollinger Bands indicator consists of three bands plotted on the chart:
Middle Band: A simple moving average (SMA) of the price, typically set to 20 periods.
Upper Band: Calculated by adding a multiple of the standard deviation to the SMA.
Lower Band: Calculated by subtracting a multiple of the standard deviation from the SMA.
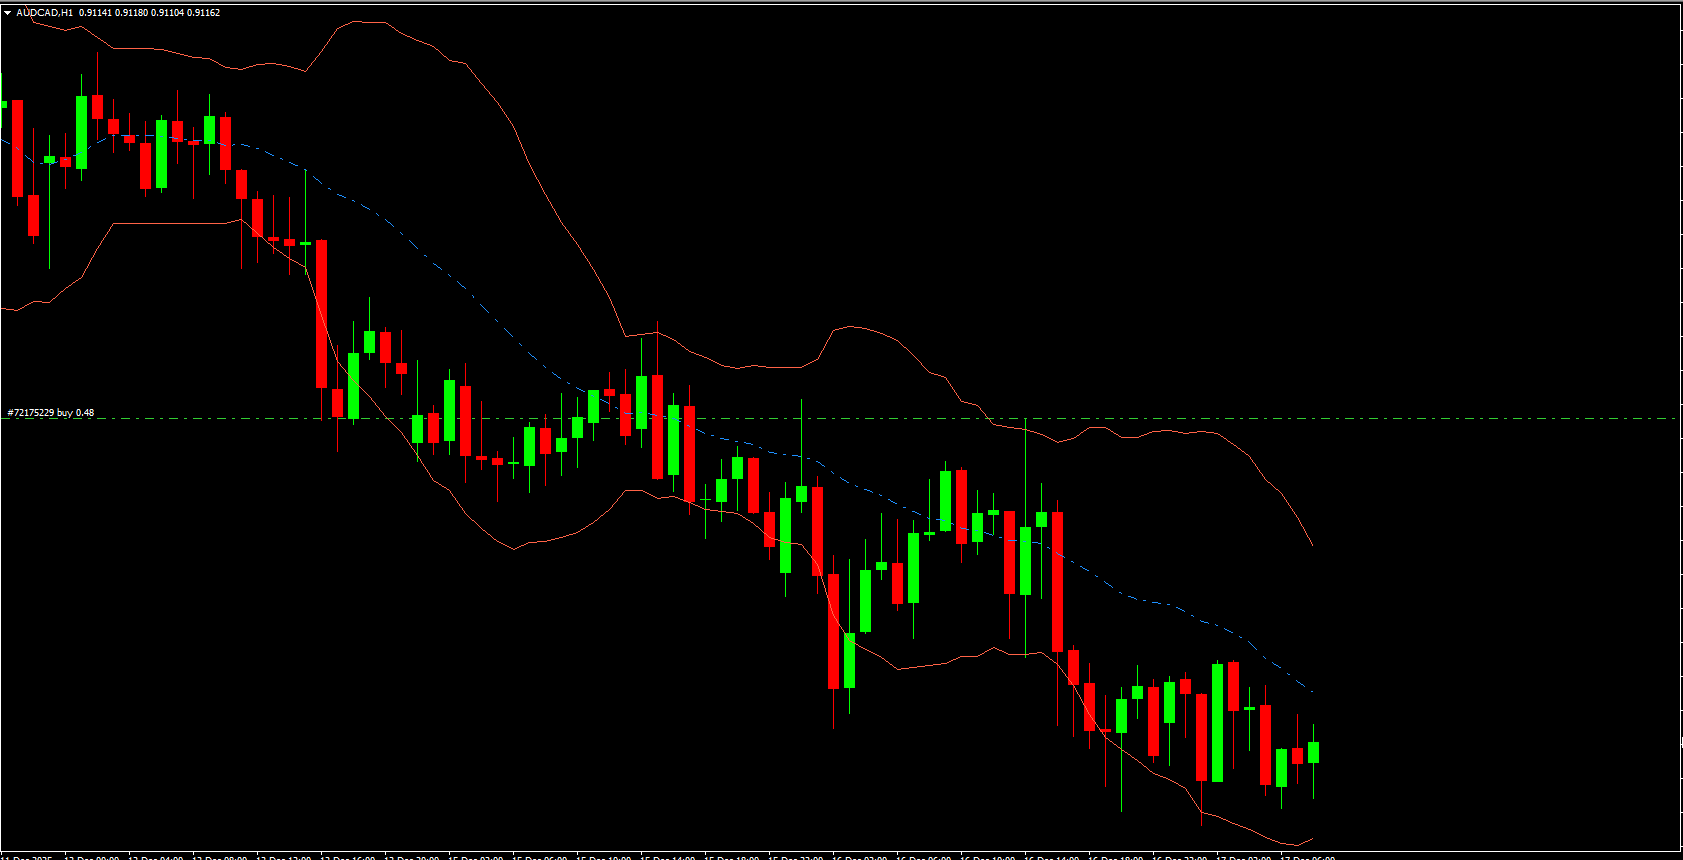
The upper and lower bands expand and contract based trend on market volatility. A wider gap indicates higher volatility, while a narrow gap signals a period of low volatility.
Trading Signals with Bollinger Bands
Buy Signal:
Occurs when the price approaches or touches the lower band, levels indicating an oversold market.
Traders can use this as a potential entry point for long positions.
Sell Signal:
Occurs when the price approaches or touches the upper band, signaling an overbought market.
Traders may consider this as a potential entry point for short positions.
The upper band often acts as a resistance level, while the lower band serves as a support level.
Traders can use these levels for trade entry, exit, or placing stop-loss orders.
Features of the Bollinger Bands Indicator
Trend Identification: Helps traders determine the market trend based on the position of the price relative to the middle band.
Volatility Measurement: Expanding and contracting bands visually represent market volatility.
Buy/Sell Signals: Indicates potential reversal or continuation zones.
Support & Resistance: Upper and lower bands serve as dynamic levels for potential price reactions.
MT4 Compatible: Free and easy to install on MetaTrader 4 charts.
Benefits of Using Bollinger Bands
Identify Overbought/Oversold Conditions: Helps traders spot potential market turning points.
Trade with Confidence: Provides clear visual cues for trend direction and market volatility.
Flexible Usage: Can be combined with other indicators like RSI, MACD, or Price Action for higher accuracy.
Beginner-Friendly: Easy to interpret with visual signals and dynamic bands.
How to Trade Using Bollinger Bands
Wait for the price to touch the lower band in an uptrend for a potential buy entry.
Enter a sell trade when the price approaches the upper band in a downtrend.
Use the middle band as a target for partial profits or as a trailing stop reference.
Combine with other indicators for confirmation to reduce false signals.
Final Thoughts
The Bollinger Bands indicator for MT4 is a simple yet powerful tool for traders looking to identify trend direction, volatility, support/resistance levels, and buy/sell signals. By understanding and using this indicator effectively, Forex traders can make more informed trading decisions and improve their overall trading performance.
FAQ
Bollinger Bands display volatility and potential overbought/oversold conditions using a moving average and standard deviation bands. They help identify price extremes and potential reversal points.
Price touching the upper band may indicate overbought conditions, price touching the lower band may suggest oversold conditions, band width shows volatility, and price moving outside bands may signal strong momentum or reversals.
Trade bounces from band extremes in ranging markets, trade breakouts when bands expand, use band squeezes to anticipate volatility expansion, and combine band analysis with trend direction.
Bollinger Bands adapt to volatility changes, provide dynamic support/resistance levels, help identify overbought/oversold conditions, and offer multiple trading strategies in one indicator.
Combine with trend indicators for direction, use with momentum oscillators for confirmation, integrate with volume analysis, and combine with price action patterns for stronger signals.
1 Download
Published:
Dec 17, 2025 02:59 AM
Category: