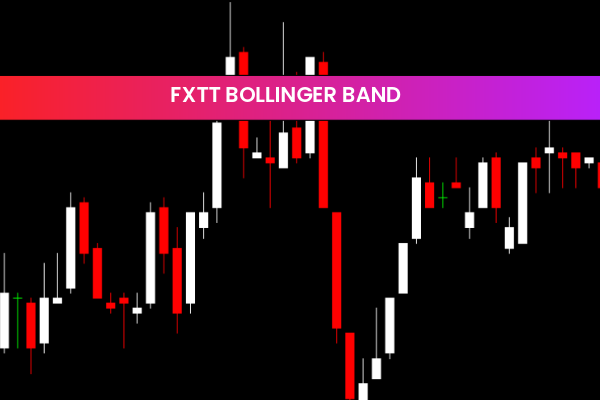
Precision Volatility Analysis with the Bollinger Bands Breakout Oscillator
In the fast-paced ecosystem of technical trading, identifying the transition from a low-volatility "squeeze" to a high-velocity trend is the ultimate objective. While standard Bollinger Bands are a staple for visualizing market boundaries, they often lead to "chart clutter" and subjective interpretations of Price Action. The Bollinger Bands Breakout Oscillator (BBBO) is a professional-grade technical solution that distills volatility and momentum into a streamlined sub-window interface, providing traders with an objective, data-driven signal for explosive market expansions.
The Mechanics of the Volatility Cycle
The Bollinger Bands Breakout Oscillator is built on the fundamental principle that markets oscillate between periods of relative calm and intense activity. By quantifying the relationship between price and standard deviation, the indicator identifies the exact moment when the market's "pressure cooker" effect reaches a tipping point. Unlike traditional bands that wrap around price, this oscillator displays the breakout potential as a momentum-based histogram, making it easier to spot sustainable trends.
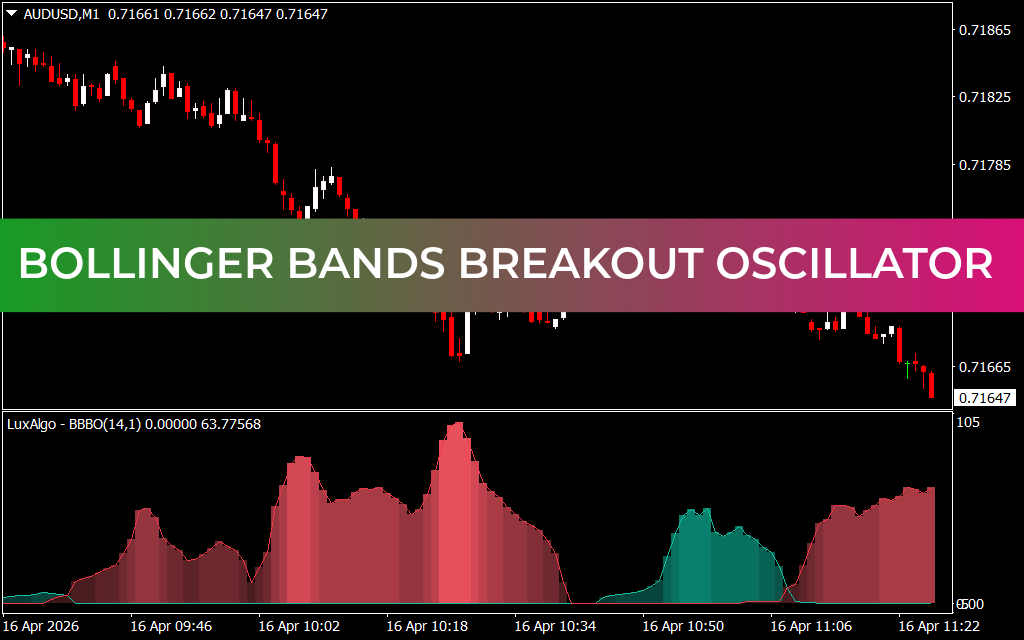
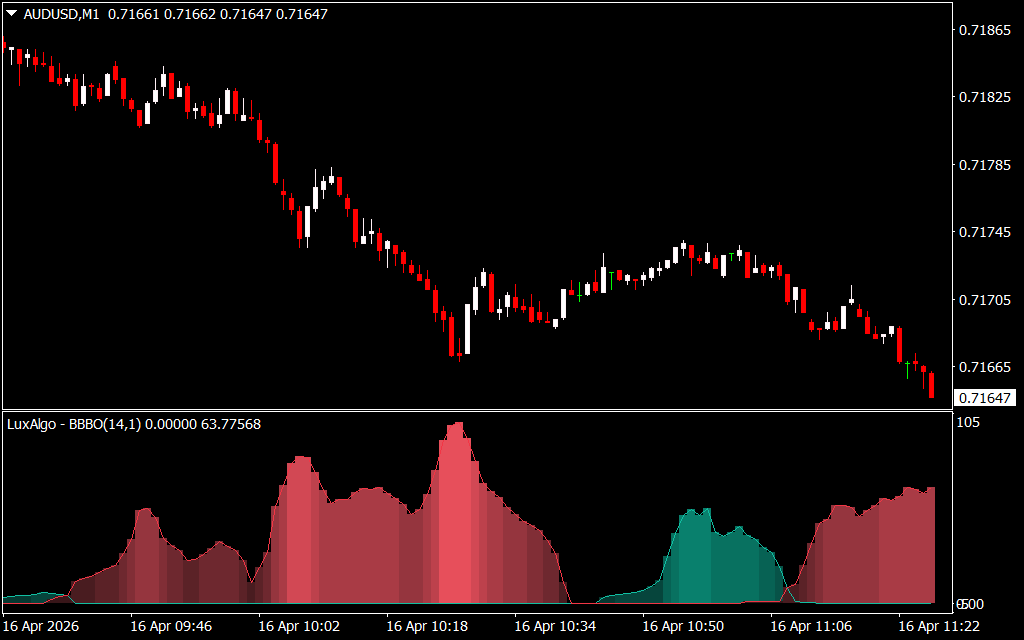
As observed in technical analysis across the EUR/USD and AUD/USD timeframes, the BBBO provides a sophisticated visual framework:
- The Momentum Histogram: Centered around a zero-line, the histogram bars change size and color based on the intensity of the breakout. A shift from small, neutral bars to large, colored bars indicates that a breakout has confirmed momentum behind it.
- Volatility Expansion Thresholds: The indicator features signal lines that act as "trigger zones." When the histogram pierces these outer levels, it signals that the price has moved beyond the expected statistical range, confirming a high-conviction breakout.
- Color-Coded Market States: The oscillator typically uses color transitions (such as green for bullish and red for bearish) to represent the current state of market expansion, allowing for "at-a-glance" analysis of the dominant trend.
Strategic Implementation for Professional Results
The Bollinger Bands Breakout Oscillator is engineered to be a cornerstone of a systematic trading approach, whether you are a scalper or a swing trader.
- Objective Entry Timing: One of the greatest challenges of breakout trading is avoiding "fake-outs." The BBBO filters out noise by requiring momentum to exceed a specific threshold before a signal is generated.
- Visualizing the "Squeeze": Before a major move, the histogram often stays flat near the zero-line. This "oscillator squeeze" acts as a leading warning that a significant volatility expansion is imminent.
- Trend Exhaustion Detection: As a trend matures, the histogram bars will begin to shrink back toward the zero-line. This serves as a primary exit signal, warning traders to lock in profits before a mean-reversion move occurs.
- Multi-Timeframe Versatility: While highly effective for M1 and M5 Scalping, the indicator is robust on H1 and H4 charts for identifying large-scale session breakouts during the London and New York overlaps.
Conclusion
The Bollinger Bands Breakout Oscillator is a definitive tool for traders who prioritize mathematical objectivity over visual guesswork. By converting complex band dynamics into a highly readable momentum signal, it empowers you to navigate market volatility with professional confidence. Elevate your technical strategy today and master the market's most explosive moves.
17 Downloads
Last Update:
Apr 16, 2026 14:28 PM
Published:
Feb 10, 2026 20:12 PM
Category: