Master Market Volatility with the Bollinger Bands Indicator for MT5
In the world of technical analysis, few tools are as versatile and widely respected as Bollinger Bands. Developed by John Bollinger in the 1980s, this indicator has become a staple for traders across all asset classes, from Forex to stocks and crypto. The Bollinger Bands for MetaTrader 5 (MT5) provide a dynamic view of market volatility, helping traders identify overextended price levels and potential breakout opportunities with professional clarity.
The Mechanics of Volatility Envelopes
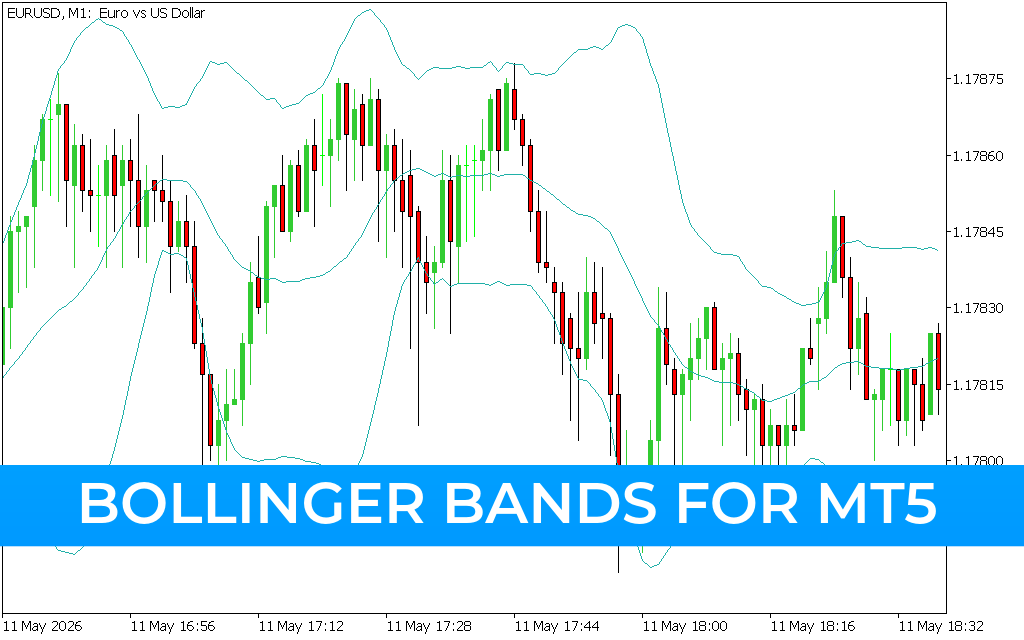
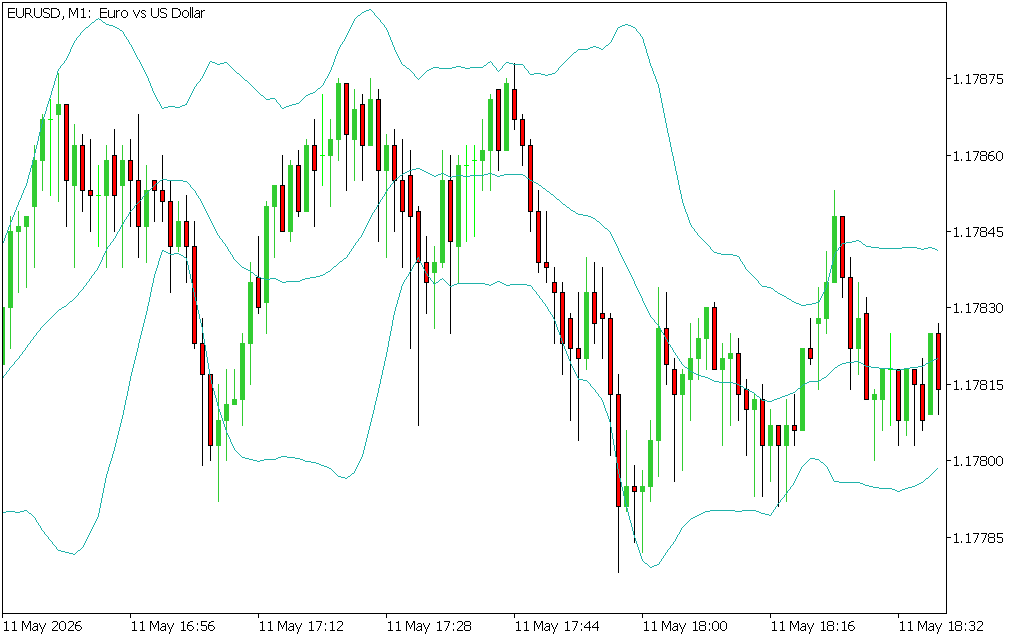
Bollinger Bands consist of three distinct lines that wrap around the Price Action, creating a "channel" that expands and contracts based on market conditions:
- The Middle Band: A standard 20-period Simple Moving Average (SMA). This serves as the baseline for the trend and the "mean" price level.
- The Upper Band: Plotted two standard deviations above the Middle Band. This area represents a zone of bullish overextension.
- The Lower Band: Plotted two standard deviations below the Middle Band. This area represents a zone of bearish overextension.
As seen in the EUR/USD M1 chart, the bands act as a mathematical container. Because standard deviation is a measure of volatility, the bands automatically widen during periods of high market activity and narrow (or "squeeze") during quiet, ranging markets.
Key Trading Strategies and Signals
The Bollinger Bands indicator is renowned for its ability to generate high-probability signals across different market regimes:
- The Bollinger Squeeze: This is one of the most powerful signals in technical analysis. When the bands tighten significantly, it indicates a period of extremely low volatility. This "calm before the storm" often precedes an explosive price breakout. Traders watch for the bands to begin expanding as a signal that a new trend is starting.
- Mean Reversion (The Bollinger Bounce): Price has a natural tendency to return to the middle SMA. In a ranging market, price often touches the upper band and "bounces" back toward the midline. Conversely, touches of the lower band often attract buyers looking for a discount.
- Walking the Bands: In a very strong trend, price will often ride along the upper or lower band without returning to the middle. This "walking the bands" behavior is a sign of intense momentum and discourages traders from trying to pick a top or bottom prematurely.
- W-Bottoms and M-Tops: Bollinger used the bands to identify structural patterns. A "W-Bottom" occurs when price touches the lower band, bounces, and then makes a second low that stays above the lower band, signaling a shift in momentum from sellers to buyers.
Why Use Bollinger Bands on MT5?
The MetaTrader 5 version of Bollinger Bands offers superior execution and visual clarity. Whether you are a scalper looking for quick volatility bursts on the M1 timeframe or a swing trader managing H4 positions, the bands provide a standardized, objective framework for setting stop-losses and take-profit targets.
By integrating Bollinger Bands into your MT5 setup, you gain the ability to "see" volatility. This allows you to avoid trading in stagnant markets and ensures you are positioned to capture the market's most significant moves.
Last Update:
May 11, 2026 22:04 PM
Published:
Jan 24, 2026 13:07 PM
Category: