Enhancing Technical Strategy with the Bollinger Bands STARC Indicator
Navigating the complexities of the financial markets requires tools that can effectively interpret volatility and identify structural boundaries. While standard technical systems often depend on standalone indicators, advanced technical analysts know that combining complementary analytical methods yields a more robust trading framework. A premier example of this conceptual synergy available for MetaTrader platforms is the Bollinger Bands STARC Indicator.
By overlaying two distinct band methodologies—Bollinger Bands and Starc (Stoller Average Range Channels) Bands—this advanced technical tool gives day traders, scalpers, and swing traders a dual-layered approach to mapping market extremes.
The Synergy Behind the Indicator
To understand the power of this tool, it is essential to look at the mathematical mechanics of both envelope systems. While they appear similar at a glance, they calculate market volatility from entirely different perspectives.
- Bollinger Bands: Developed by John Bollinger, these bands expand and contract based on standard deviation around a Simple Moving Average (SMA). They are highly sensitive to sudden, explosive price moves and shifts in market velocity.
- STARC Bands: Created by Manning Stoller, these channels use the Average True Range (ATR) to bracket a central moving average. Because the ATR measures true trading ranges rather than statistical variances, STARC bands provide a smoother, more structural baseline of volatility.
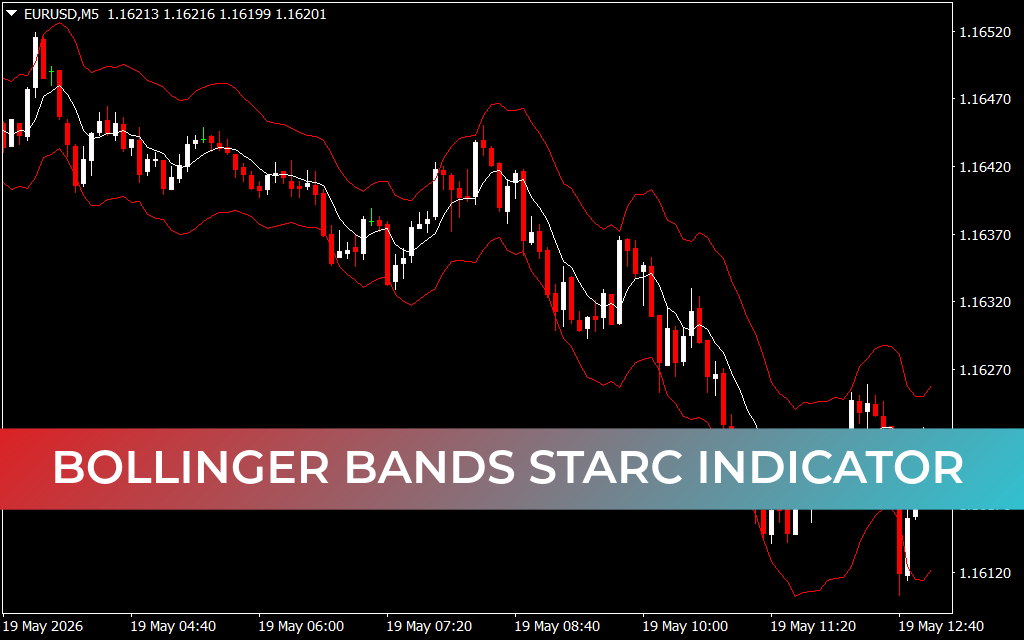
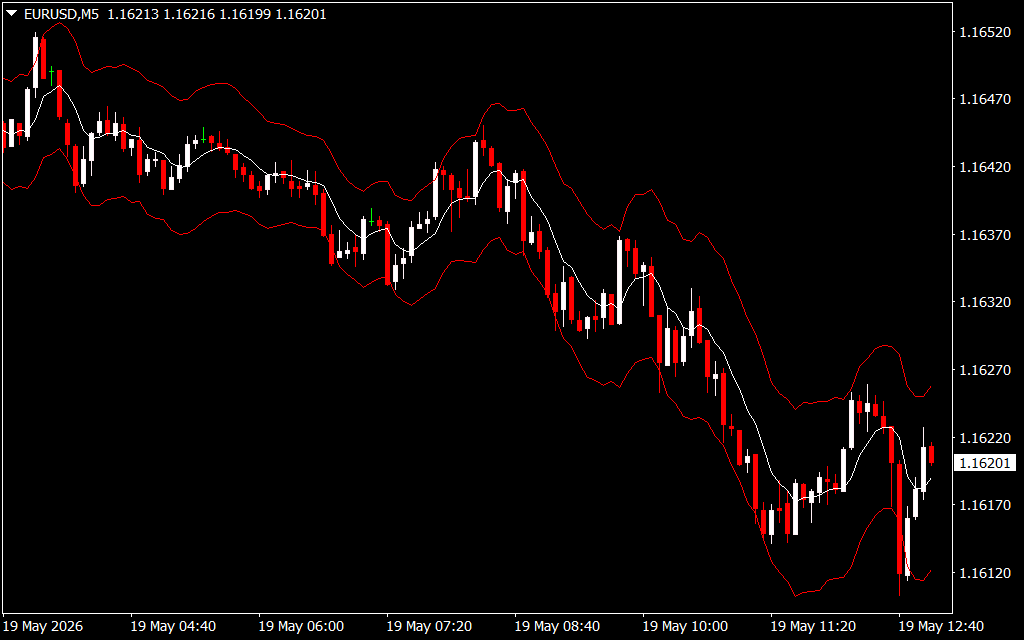
When combined into a single visual script, as shown on the 5-minute (M5) chart, they create an intelligent trading corridor. The overlapping bands establish a gradient of Support And Resistance zones, allowing traders to see exactly when price action transitions from normal distribution into high-probability execution zones.
Key Trading Applications and Strategies
Implementing the Bollinger Bands STARC Indicator into your daily routine provides a highly rule-based approach to both Trend Following and counter-trend trading.
1. Advanced Mean Reversion
When the market enters a consolidation or ranging phase, the space between the inner STARC bands and outer Bollinger Bands acts as an ultimate boundary. If a currency pair like the EUR/USD breaks through the inner channels and pierces the outermost band, it signals that the asset is severely overextended. Technical traders use these nested rejections to anticipate quick, high-probability reversals back toward the central white moving average line.
2. High-Velocity Breakout Confirmation
During intense macroeconomic news events, the market experiences massive volatility expansion. A clean, high-volume candle close above or below the combined outer bands indicates that the market has left its historical fair-value range. Instead of looking for a reversal, trend traders can use this expansion to trade high-momentum breakout continuations.
3. Precision Trailing Stops
Beyond trade entry, this dual-band indicator serves as an exceptional engine for risk management. In a prolonged markdown or markup, traders can trail their defensive stop-losses along the structural lines of the STARC bands, ensuring they extract maximum pip value while protecting their trading capital from early stop-outs.
Streamlining Your Visual Analytics
The Bollinger Bands STARC Indicator is an invaluable utility for any serious technical analyst who wants to eliminate guesswork from their charting routine. By providing an objective, dual-perspective map of market volatility, it ensures you trade with structure and confidence in any market condition.
2 Downloads
Last Update:
May 19, 2026 16:03 PM
Published:
Jan 19, 2026 19:49 PM
Category: