Master High-Probability Reversals with Bollinger RSI Starc V1
In high-velocity financial markets, identifying when an asset is overextended is the key to locking in consistent profits. Many retail traders fail because they buy at the absolute top or sell at the very bottom, falling victim to institutional traps. The Bollinger RSI Starc V1 indicator for MetaTrader is engineered to solve this dilemma. By combining three of the most powerful volatility and momentum concepts in technical analysis into a single, unified chart overlay, this tool gives you a definitive map of market extremes.
Understanding the Triple-Confluence System
The Bollinger RSI Starc V1 does not rely on a single mathematical formula. Instead, it creates an algorithmic hybrid that maps price boundaries using a smoothed volatility channel. Unlike standard oscillators that sit in a sub-window, this custom indicator plots its data directly over your primary Price Action, ensuring you never lose sight of structural candlestick patterns.
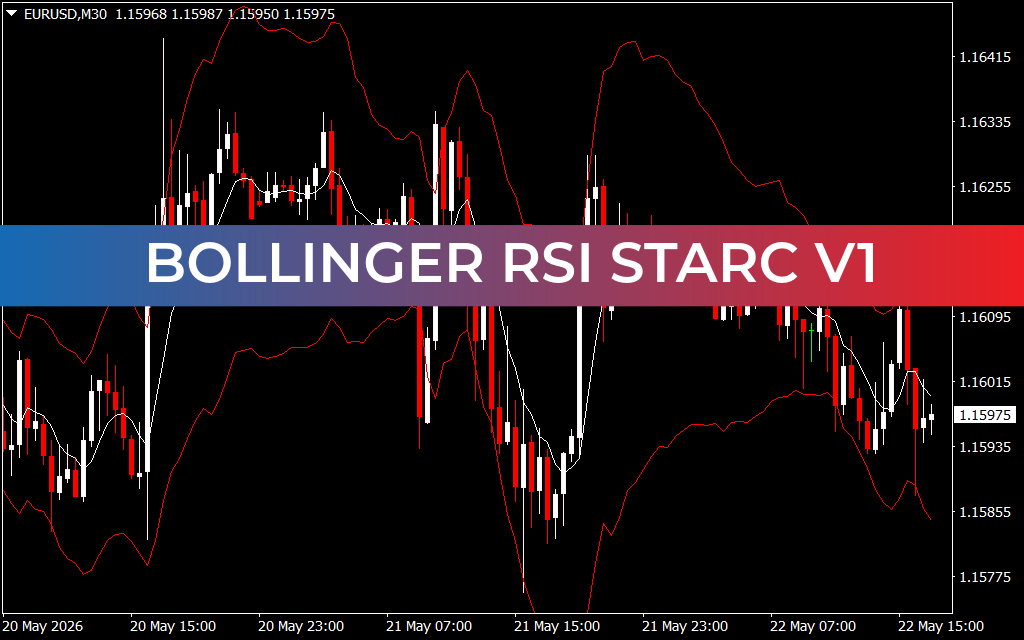
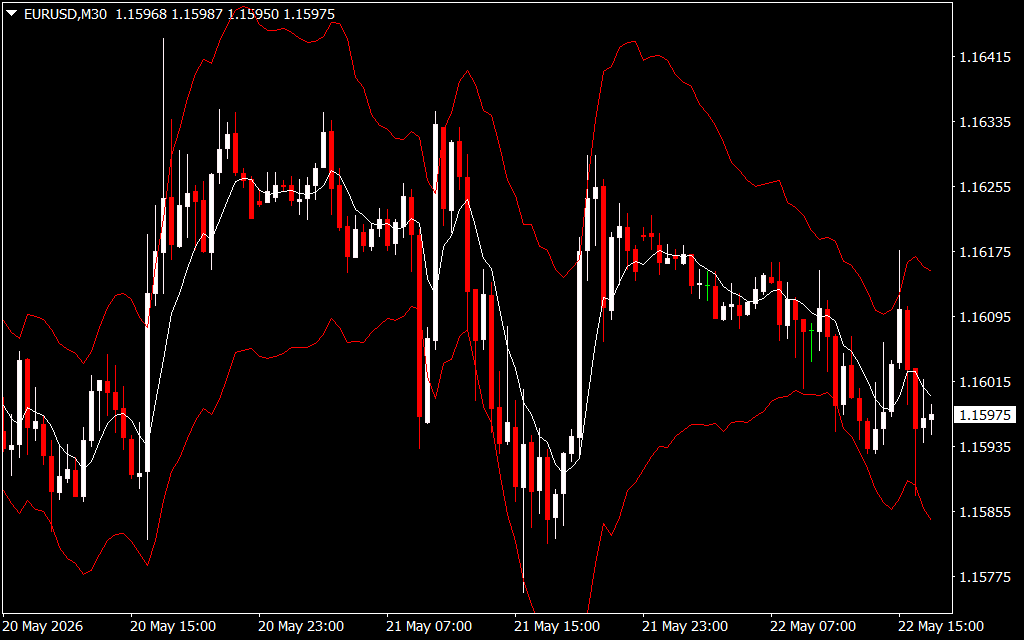
As displayed on the EURUSD M30 chart, the indicator builds a highly visual execution field:
- The Volatility Channel (Outer Red Lines): These outer boundaries combine the standard deviation logic of Bollinger Bands with the average true range (ATR) calculations of Starc bands. They expand during high-volume breakout sessions and contract during tight market squeezes.
- The Median Equilibrium Line (White Centerline): This acts as the dynamic mean reversion anchor for the asset. When price stretches too far from this line, it acts like a rubber band, pulling price back toward equilibrium.
- Integrated RSI Smoothing: The indicator processes underlying Relative Strength Index (RSI) data to adjust the sensitivity of the bands dynamically, preventing the lagging false signals common in traditional channel indicators.
Key Trading Advantages and Features
- All-In-One Unified Overlay: Keeps your trading workspace clean and organized by blending momentum and volatility analysis right onto the main candlestick panel.
- Accurate Overbought/Oversold Detection: Pinpoints precise exhaustion zones where institutions are likely to take profits and reverse the market.
- Dynamic Volatility Tracking: The channels adapt automatically to shifting market environments, making it highly effective across both trending and range-bound sessions.
- Multi-Timeframe Versatility: Performing exceptionally well on the 30-minute timeframe for intraday day traders, it scales perfectly up to H4 or daily charts for macro swing traders.
Strategic Execution Using Bollinger RSI Starc V1
To turn this advanced volatility map into a robust trading strategy, follow a disciplined mechanical approach:
- Spotting the Mean Reversion Setup: Watch for price to pierce or close completely outside the outer red boundary lines. A strong candlestick rejection (like a long-wick pin bar or engulfing pattern) at these extremes signals that a powerful counter-trend correction is imminent.
- Targeting the Dynamic Median: When executing a reversal trade at the outer bands, use the middle white centerline as your primary take-profit target. This ensures you capture the high-probability meat of the move before price consolidates.
- Strict Risk Management: Place your protective stop-losses slightly beyond the recent structural swing high or swing low established outside the channel boundaries. This keeps your risk defined and safely backed by mathematical extremes.
2 Downloads
Last Update:
May 22, 2026 20:04 PM
Published:
Jan 17, 2026 16:28 PM
Category: