Navigating Volatility with the Bollinger RSI Starc V1 Indicator
In modern technical analysis, combining non-correlated data points is the most effective way to build a high-probability trading model. Many retail traders fail because they fill their charts with redundant indicators—such as stacking multiple moving averages that print identical lag-driven signals. To achieve true confluence without workspace clutter, advanced traders use hybrid tools that combine volatility envelopes with momentum oscillators. The Bollinger RSI Starc V1 Indicator is a premium solution built specifically to provide this structural edge for MetaTrader users.
By integrating the range-bound analysis of Bollinger Bands and Starc Bands with the structural strength of the Relative Strength Index (RSI), this technical powerhouse serves as an all-in-one framework for scalpers, day traders, and swing traders alike.
The Anatomy of Bollinger RSI Starc V1
The indicator approaches Price Action from two distinct angles simultaneously: volatility expansion and momentum exhaustion. Instead of throwing raw mathematical variables at your chart, it creates a synchronized envelope layout.
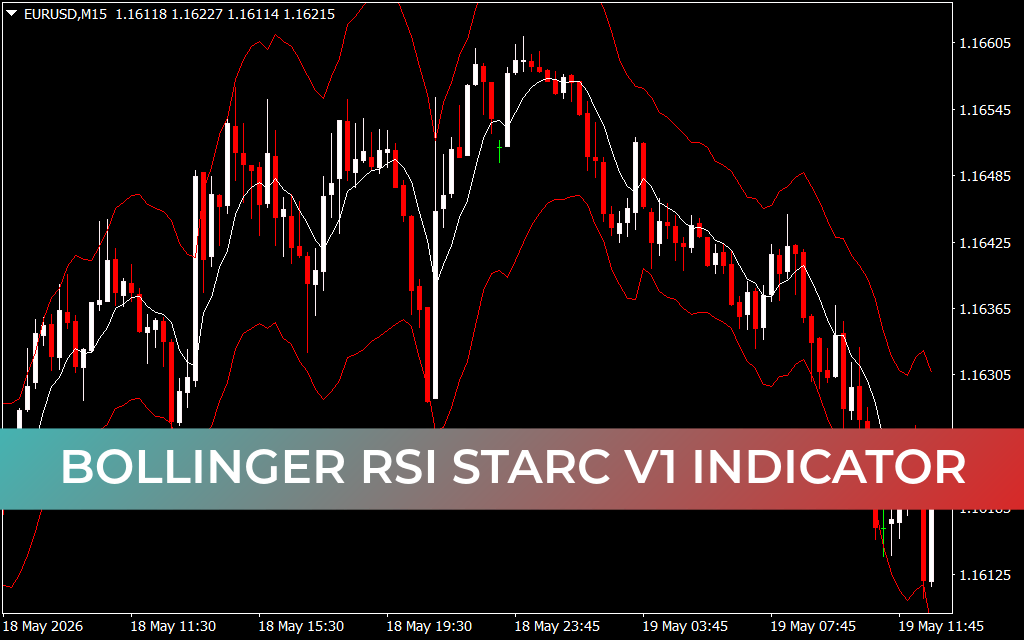
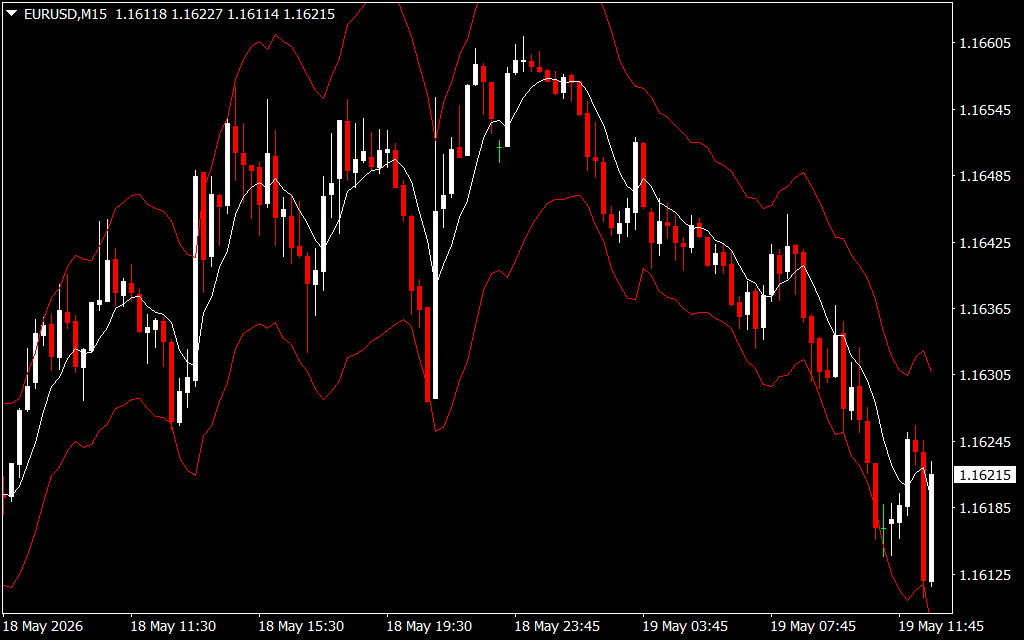
As showcased beautifully on the 15-minute (M15) chart, the indicator wraps price action in an intelligent volatility structure:
- The Outer Red Envelopes: These bands dynamically expand and contract based on market volatility (derived from standard deviation and Average True Range calculations), setting clear statistical limits for daily price movement.
- The Central Baseline: A smoothed white moving average that represents the short-term fair value or market equilibrium.
Woven deep into this volatility channel is an underlying RSI filtering mechanism. When the price aggressively drives toward an outer boundary while the internal RSI calculation hits an overbought or oversold threshold, the indicator identifies a high-confluence zone for a potential market reversal.
Advanced Strategic Applications
Deploying the Bollinger RSI Starc V1 Indicator across liquid assets like the EUR/USD unlocks powerful systematic methodologies:
1. Volatility Breakout Tracking
During major session transitions, the outer red bands will tightly constrict, signaling a low-volatility squeeze. When an institutional volume spike occurs, price will forcefully break outside the bands. Traders can use a clean candle close past the outer boundary as a direct confirmation that a powerful macro expansion phase has begun.
2. Counter-Trend Mean Reversion
When the market lacks heavy fundamental drivers, it naturally respects volatility limits. If price stretches completely outside the upper or lower red bands and prints an exhaustion candlestick pattern, it signals that the move is statistically unsustainable. Traders can initiate low-risk counter-trend setups, targeting a rapid snap-back move to the central white baseline.
3. Dynamic Trailing Protection
The multi-band envelope structure acts as an excellent roadmap for active risk management. In a sustained market markdown, traders holding short positions can seamlessly trail their protective stop-losses along the upper descending bands, ensuring they maximize their pip capture while avoiding premature exits.
Streamline Your Visual Analytics
The Bollinger RSI Starc V1 Indicator completely redefines charting efficiency by replacing subjective interpretation with objective mathematical boundaries. By allowing you to monitor trend structure, volatility, and momentum convergence simultaneously, it ensures you enter the market with institutional precision.
1 Download
Last Update:
May 19, 2026 15:59 PM
Published:
Jan 19, 2026 19:53 PM
Category: