Strategic Volatility Analysis with the Bollinger Squeeze Rainbows Indicator
In the high-velocity environment of Forex and CFD trading, the transition from a low-volatility "squeeze" to a high-volatility trend expansion is where the most significant profit opportunities reside. The Bollinger Squeeze Rainbows for MetaTrader 4 (MT4) and MT5 is an advanced technical suite designed to visualize these transitions with multi-layered precision. By integrating Bollinger Band squeezes with a "Rainbow" moving average array and momentum oscillators like the DeMarker, this indicator provides a comprehensive roadmap of market energy and structural Trend Strength.
The Anatomy of a Volatility Squeeze
The core philosophy of this indicator is that periods of extreme market quiet (squeezes) are invariably followed by explosive moves. The Bollinger Squeeze Rainbows utility uses several layers of analysis to confirm these breakouts:
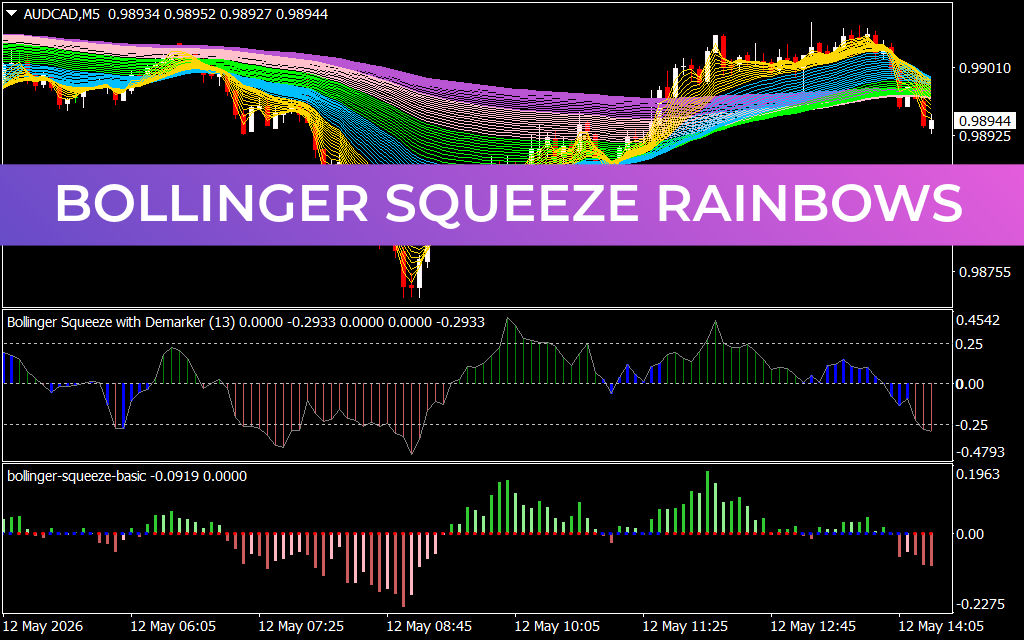
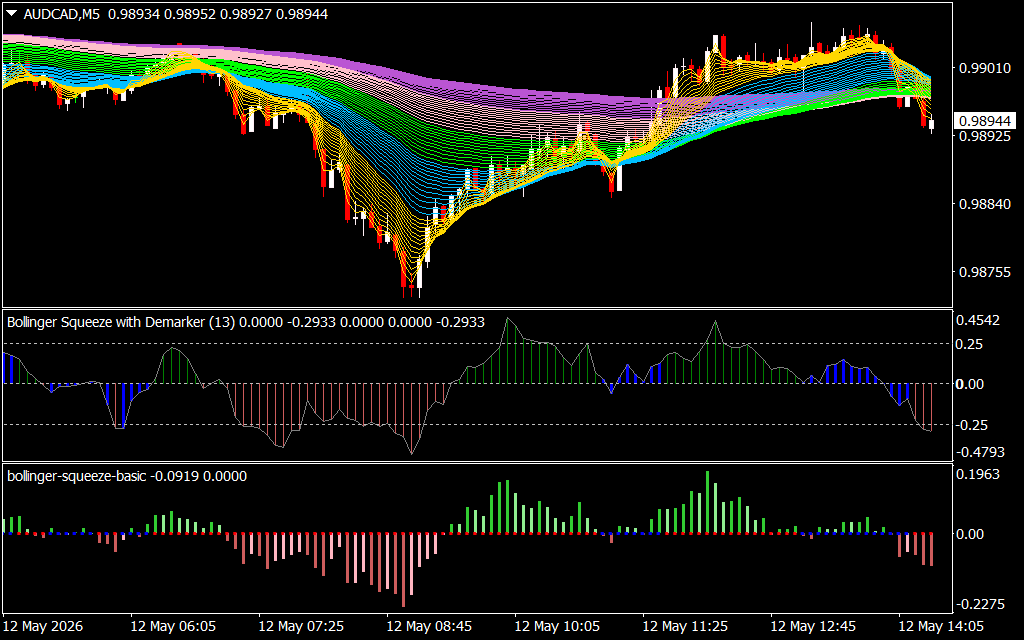
- The Rainbow Moving Average Ribbon: Plotted on the main price chart, this multi-color ribbon consists of numerous moving averages of varying periods. When the ribbon is tightly compressed and "braided," the market is in a consolidation phase. As the ribbon fans out and takes on a distinct color gradient (e.g., yellow to purple), it confirms a powerful, established trend.
- The Bollinger Squeeze Histogram: Located in the sub-window, this tracks the relationship between Bollinger Bands and Keltner Channels. Red histogram bars indicate a "squeeze" where volatility is building under pressure. A switch to green or blue bars marks the "release" of that pressure, signaling a high-probability breakout entry.
- DeMarker Integration: The secondary oscillator (Bollinger Squeeze with Demarker) adds a layer of momentum confirmation. By tracking overbought and oversold conditions within the squeeze framework, it helps traders filter out weak breakouts and focus on high-conviction momentum shifts.
Tactical Execution and Chart Insights
As shown in the AUD/CAD M5 chart, the Bollinger Squeeze Rainbows system excels at identifying the "breathing" cycles of the market:
- The Build-Up: Before a major move, the histogram bars turn red and the Rainbow ribbon flattens. This is the visual cue for traders to prepare for an imminent expansion.
- The Breakout Signal: When price breaks above or below the Rainbow ribbon and the histogram simultaneously shifts to positive (green) or negative (pink) momentum, a trend has officially begun.
- Trend Sustainability: During a strong trend, the Rainbow ribbon provides a "cushion" of dynamic support or resistance. As long as the ribbon remains wide and the color order is maintained, the trend is considered healthy and likely to continue.
Strategic Advantages for Professional Traders
The Bollinger Squeeze Rainbows indicator is a critical asset for building a sophisticated, multi-factor trading strategy:
- Visualizing Hidden Liquidity: The indicator makes it easy to see where market liquidity is being trapped, allowing you to enter as the "Smart Money" pushes price out of consolidation.
- Multi-Timeframe Confirmation: The Rainbow ribbon acts as a natural filter; if the short-term averages are moving against the long-term averages (the "core" of the ribbon), you are warned to stay out of a potentially choppy market.
- Advanced Exit Strategy: A narrowing of the Rainbow ribbon or a return of the histogram toward the zero line serves as an objective signal that a trend is losing steam, providing a logical exit point before a reversal occurs.
Conclusion
The Bollinger Squeeze Rainbows indicator transforms your MetaTrader platform into a high-powered volatility laboratory. By combining the predictive power of squeezes with the trend-following clarity of Rainbow ribbons, it offers a dual-edge analytical approach. Equip your technical workspace with this professional utility to trade volatility expansions with the precision and confidence required for long-term success.
2 Downloads
Last Update:
May 12, 2026 17:29 PM
Published:
Jan 23, 2026 12:36 PM
Category: