Simplify Market Geometry: BP Channel Indicator for MetaTrader 4
Trading fluid, fast-moving currency markets on intraday timeframes like the 15-minute (M15) chart demands structural perspective. Without an objective framework to map volatility, retail day traders often make the mistake of buying at the absolute peak of an overextended expansion or selling directly into the base of a major liquidity pool. The BP Channel Indicator for MT4 addresses this structural challenge by projecting dynamic volatility bands and dynamic mean baselines directly onto your chart workspace.
Decoding the Mathematics of Volatility Bands
Unlike rigid horizontal support lines or lagging moving averages, the BP Channel Indicator employs an advanced mathematical logic that adapts to live market conditions. It maps Price Action using a three-tiered volatility envelope framework, drawing a structural channel directly over your asset candlesticks.
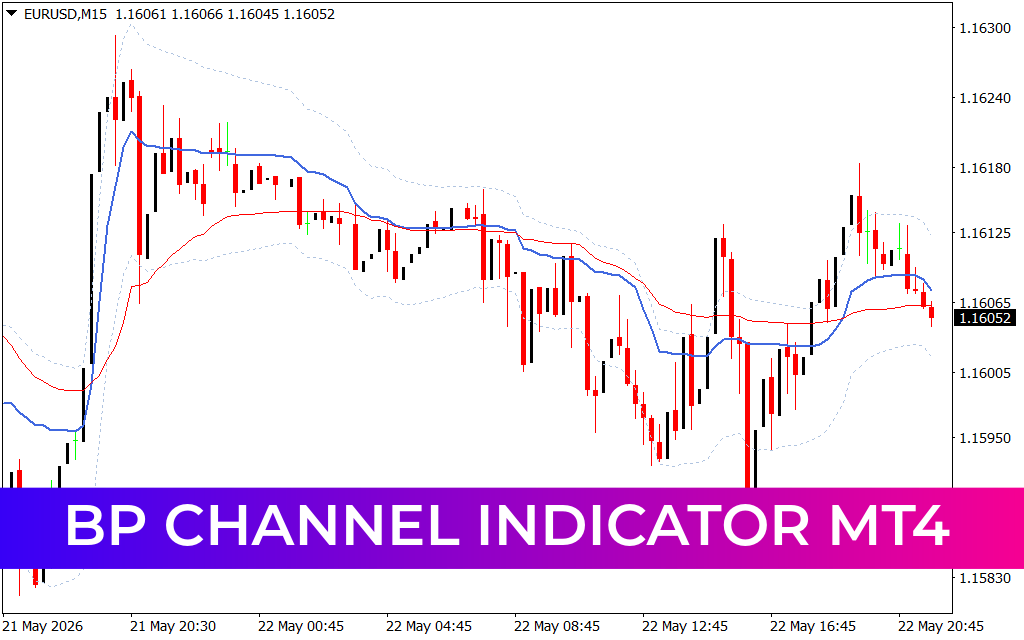
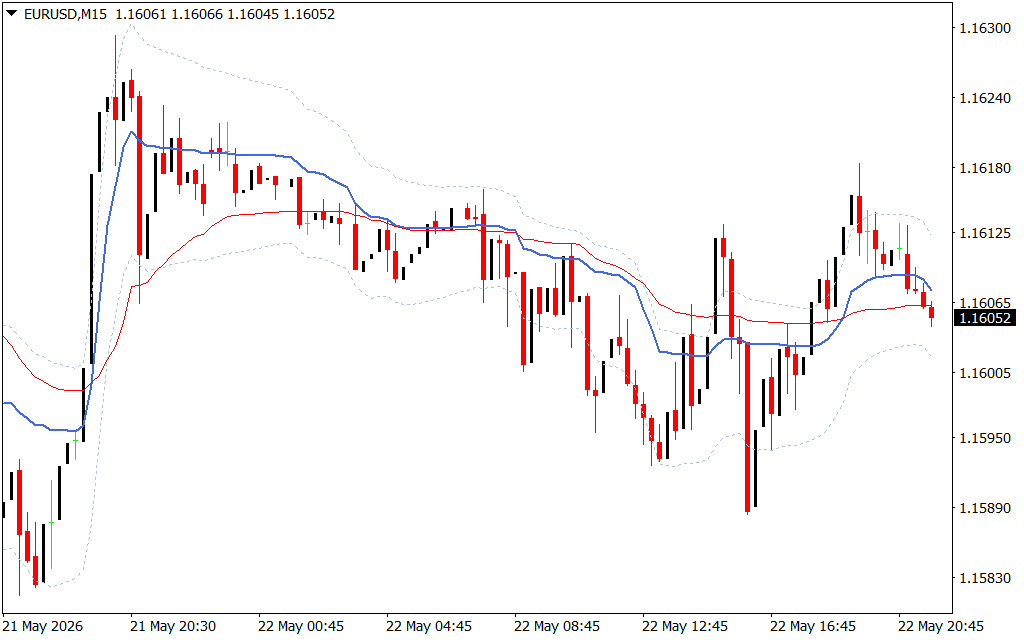
When applied to an active M15 EUR/USD workspace, the indicator's core architecture offers immediate visual guidance:
- The Upper Boundary (Dotted Outer Band): Marks the upper limits of statistical distribution. When price drives into this zone, it indicates an overextended bullish expansion where buying pressure is mathematically exhausted.
- The Central Equilibrium (Solid Blue & Red Baselines): Functions as the market's dynamic mean or fair value tracker. The line transitions cleanly between blue (bullish trend dominance) and red (bearish trend dominance) to reveal institutional order flow.
- The Lower Boundary (Dotted Outer Band): Highlights the lower bounds of price distribution. When a sell-off penetrates this band, it signals severe structural contraction, warning sellers that a corrective bounce is highly probable.
By containing price action within an automated envelope, this tool completely eliminates the guesswork from channel analysis and identifies key pivot points at a glance.
Strategic Execution on the EUR/USD M15 Chart
During liquid market sessions, major pairs like the EUR/USD constantly fluctuate between expansion trends and mean-reversion cycles. On an M15 chart workspace, a sudden high-volume impulse leg can cause prices to rapidly deviate from the central baselines and test the outer boundaries.
Systematic market participants can utilize the BP Channel tool to structure two high-probability trading models:
- Mean Reversion Scales: When price aggressively sweeps past the lower dotted band and prints a price action rejection candle (such as a long-wick pin bar), it confirms an exhaustion setup. Traders can open a long position targeting a return to the central equilibrium line.
- Trend Phase Tracking: Use the central line's color matrix as an operational filter. If the baseline is solid blue, focus exclusively on looking for value-buy pullbacks at the mid-line. If the line shifts to red, adapt your bias to look for short setups as price rallies into the central supply zone.
Core Features for Advanced Technical Analysts
- Automated Envelope Calculation: Eliminates the need to manually draw trend channels, updating dynamically with every live tick to preserve spatial accuracy.
- Clean Layout Integration: Plots directly on the main chart workspace, allowing you to seamlessly layer it alongside your existing price action filters, order blocks, or pivot levels.
- Universal Timeframe Compatibility: Optimized to handle rapid micro-Scalping on the M1 and M5 screens, while providing rock-solid macro tracking on the H1 and H4 charts.
The BP Channel Indicator functions as your direct analytical compass, transforming erratic, unrefined market fluctuations into a clean, geometric blueprint for consistent, professional execution.
1 Download
Last Update:
May 23, 2026 01:57 AM
Published:
Jan 17, 2026 12:03 PM
Category: