Conquer Volatility with the BSI Trend With Channel Indicator
In the world of technical analysis, traders face two primary hurdles: identifying the overall direction of the trend and finding precise entry points within that trend. Standard moving averages can help with direction, but they fail to show market volatility boundaries. The BSI Trend With Channel indicator offers a comprehensive solution by combining algorithmic trend-following lines with an adaptable volatility channel, providing a dual-layered roadmap for modern technical analysts.
Here is an in-depth breakdown of how this multi-faceted technical tool works and how to implement it effectively on platforms like MetaTrader.
What is the BSI Trend With Channel Indicator?
The BSI Trend With Channel indicator is an advanced chart overlay system engineered to map out localized Market Structure, momentum, and price extremes simultaneously. Instead of overwhelming your chart with disconnected tools, it packages trend baselines and volatility bands into a unified visual framework:
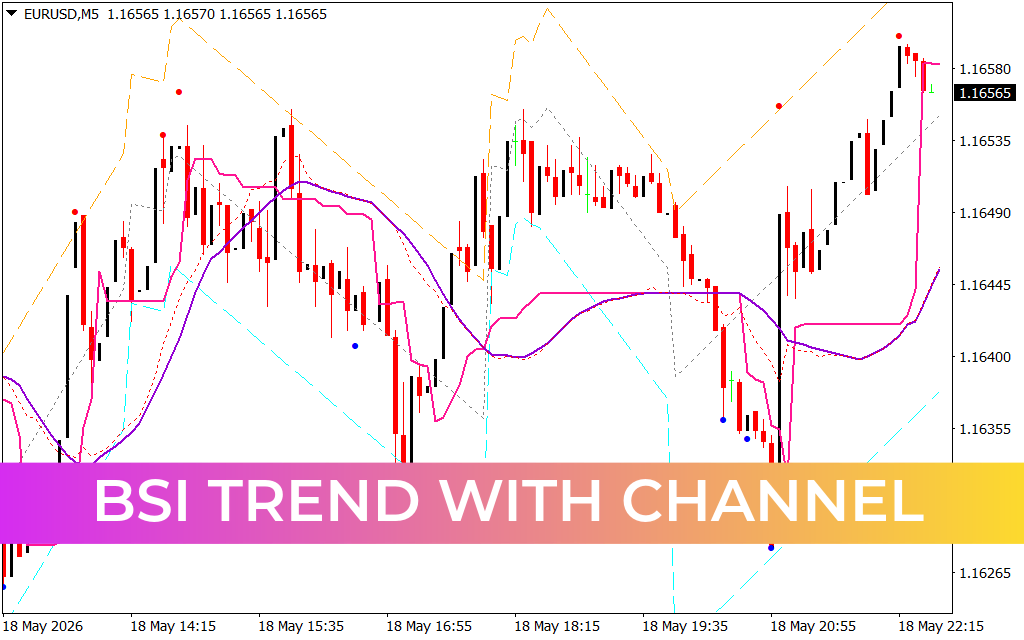
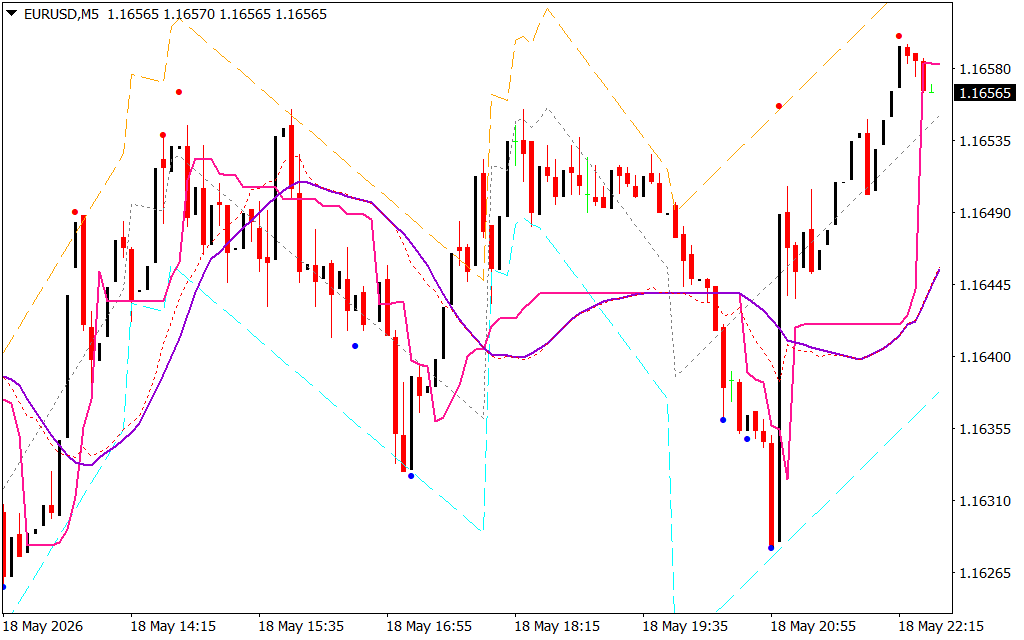
- Core Trend Baselines: The central thick purple and pink lines act as the dynamic backbone of the indicator. They calculate the market's underlying momentum, smoothing out short-term market noise to show you the clear directional bias of the asset.
- Volatility Channel Envelopes: Surrounding the Price Action are multi-colored, angular dashed lines (including upper orange and lower cyan bands). These act as dynamic, mathematical boundaries based on localized market volatility, plotting potential overbought and oversold thresholds.
- Pivot Dots: The indicator automatically plots red dots at key structural peaks and blue dots at structural swing lows, highlighting immediate areas of price exhaustion.
As displayed on the EURUSD M5 chart, the indicator tracks price swings perfectly, catching major structural bottoms precisely where the price tests the lower cyan channel line and prints a blue pivot dot.
Core Benefits for Technical Traders
- All-in-One Market Context: It eliminates the need to clutter your chart with separate trend and volatility tools by providing structural context, direction, and boundaries in a single layout.
- Precise Exhaustion Trading: The integration of the channel lines and pivot dots makes it easy to identify when an asset is overextended and ripe for a sharp reversal.
- Objective Stop Placement: The outer channel bands serve as highly effective structural areas to place protective stop-losses or plan trailing stop strategies.
Strategic Implementation and Trading Rules
To capitalize on the market matrix created by the BSI Trend With Channel indicator, traders typically utilize two core strategies:
- The Channel-Edge Bounce: Watch for instances where price stretches to touch or pierce the outer channel lines (the upper orange or lower cyan bands). If the price action hits the lower cyan band and simultaneously prints a blue structural dot, it provides a high-probability trigger for a long position.
- Trend-Core Continuation: During a strongly established trend, the central purple and pink lines act as dynamic support or resistance. Wait for price to pull back from the channel edges toward these central baselines. A rejection candle at this core level confirms that institutional volume is defending the trend, offering a safe entry in the direction of the macro move.
2 Downloads
Last Update:
May 19, 2026 01:37 AM
Published:
Jan 19, 2026 20:52 PM
Category: