Mapping Market Control: Trading Trend Shifts with the Bull Bear Balance MT4 Indicator
In the foreign exchange markets, price movement is driven by a continuous tug-of-war between buyers and sellers. For day traders and swing operators, success hinges on identifying which side holds institutional control before entering a position. Relying strictly on raw Price Action can be deceptive, as sudden retail spikes often mimic genuine breakouts. The Bull Bear Balance MT4 Indicator provides an elegant, algorithmic solution to this challenge. By analyzing internal market forces, it visualizes the shifting equilibrium of buyers and sellers, helping traders filter out noise and stay aligned with the dominant trend.
Decoding Market Equilibrium on the EUR/USD M30 Chart
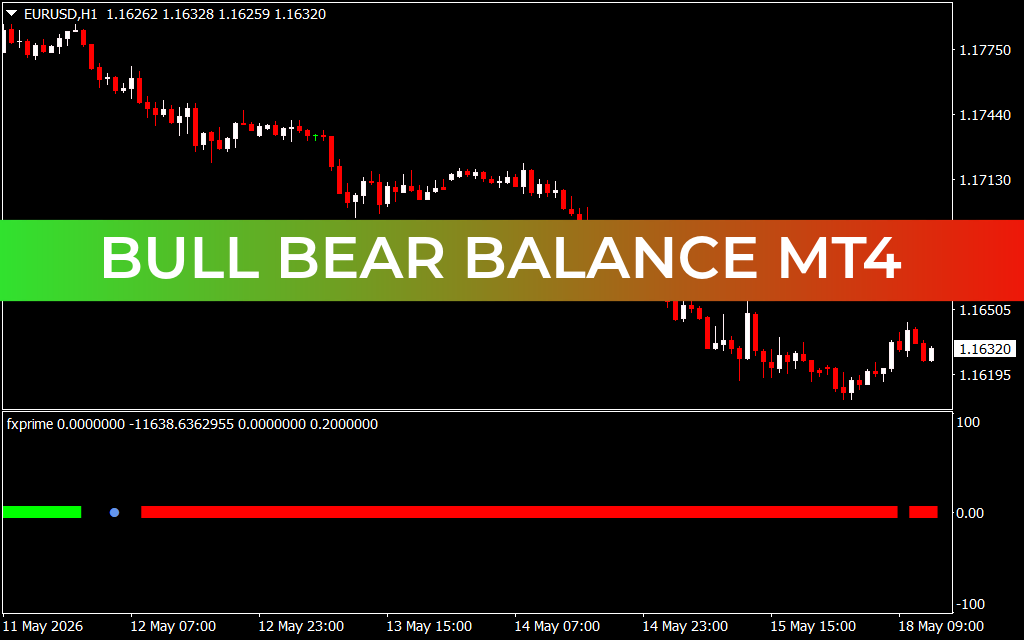
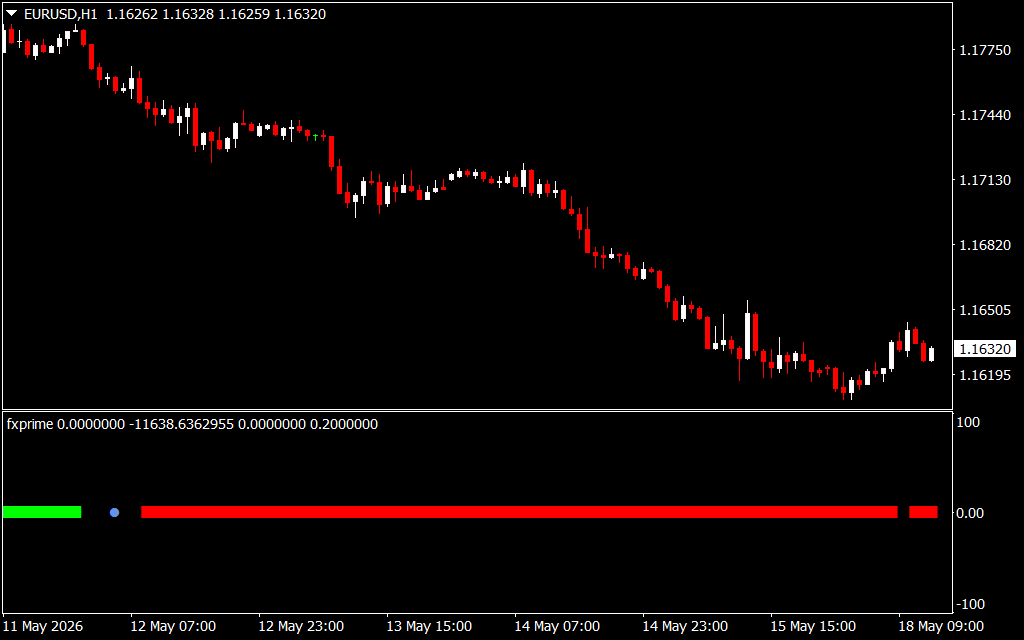
The provided EUR/USD 30-minute (M30) chart beautifully demonstrates how the Bull Bear Balance framework maps institutional order flow across a multi-day trading session. Operating directly on the price field, the indicator plots clean, horizontal Support And Resistance lines alongside discrete directional execution triggers.
During the initial phase starting on May 14, the asset entered a pronounced markdown cycle, cascading down from the 1.17175 liquidity pool. As the bears dominated the workspace, the indicator plotted localized resistance bands in red, establishing a strict overhead ceiling near 1.16905.
For short-term sellers, this technical structure provides immediate strategic clarity. Notice the blue directional arrow printing right at the breakdown point near 1.16640 on May 15. This marker alerts traders that the internal balance has tipped completely to the bears, initiating a rapid vertical expansion downward that bottomed out near the 1.16110 level.
Identifying Trend Rotations and Confluence Signals
The true predictive edge of the Bull Bear Balance MT4 indicator becomes apparent during major structural market transitions. Following a long distribution phase, the EUR/USD pair established an accumulation floor between May 15 and May 18.
As the morning session on May 18 developed, the market sentiment underwent a powerful rotation. The indicator flagged this shift by plotting a solid green horizontal boundary line right at the 1.16240 key level. When price action successfully breached and retested this green baseline, it confirmed that the bulls had reclaimed control of the underlying market balance. Another blue momentum arrow materialised just as the pair cleared local consolidation, sparking a steady markup phase toward 1.16375.
Using this indicator streamlines risk management for both high-frequency scalpers and intraday trend followers. Because the structural green (buy) and red (sell) lines act as objective balance points, traders can place highly optimized stop-loss orders just beneath or above these levels. By converting complex Supply And Demand metrics into clean on-chart visuals, the Bull Bear Balance MT4 indicator eliminates second-guessing, giving you a definitive technical edge in any market condition.
5 Downloads
Last Update:
May 18, 2026 16:35 PM
Published:
Jan 20, 2026 12:53 PM
Category: