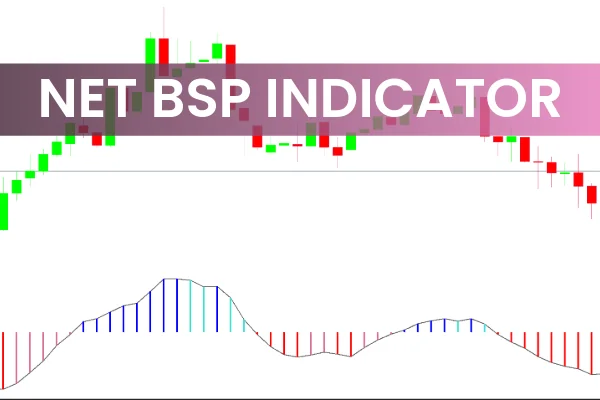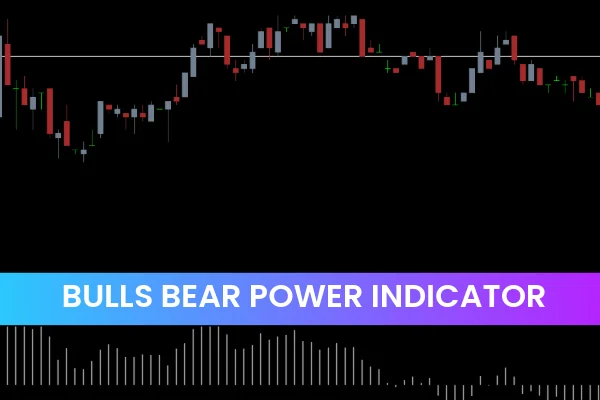
The Bulls Bear Power Indicator for MT4 is a simple yet powerful momentum-based oscillator that helps traders identify who is dominating the market — the bulls or the bears. The indicator displays histogram bars around a zero line, similar in appearance to the MACD (Moving Average Convergence Divergence), but focuses specifically on showing the balance of power between buyers and sellers.
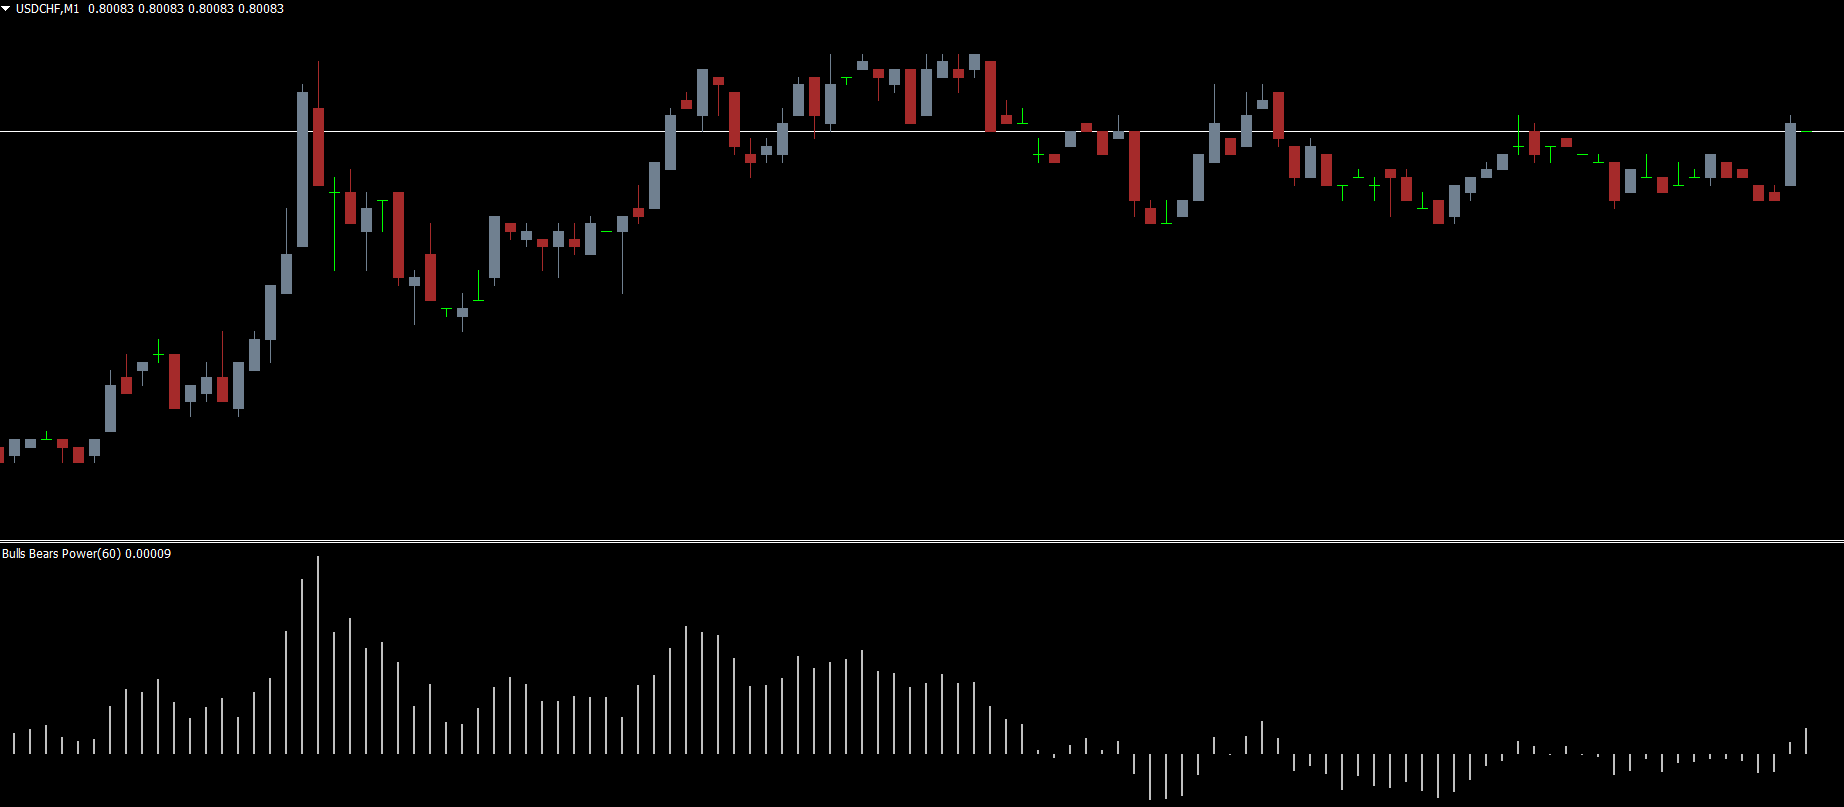
When the histogram bars move above the zero line, it signals that bulls (buyers) have taken control of the market. Conversely, when bars fall below the zero line, it means bears (sellers) are dominating.
At IndicatorForest.com, traders can download the Bulls Bear Power Indicator for free and use it to gain deeper insights into price momentum and trend direction.
How the Bulls Bear Power Indicator Works
This indicator measures the strength of bulls and bears in the market by comparing the current price movement with an exponential moving average (EMA). The result is displayed as histogram bars that oscillate above and below the zero line.
Above zero: Indicates bullish momentum — the price is likely to continue upward.
Below zero: Indicates bearish momentum — the price may continue downward.
This simple visualization makes it easier for traders to spot trend reversals, continuations, and entry or exit points without the need for complex analysis.
How to Use the Bulls Bear Power Indicator for MT4
The Bulls Bear Power Indicator can be used on any timeframe, though higher timeframes like H4 or D1 tend to provide more reliable signals by filtering out short-term market noise.
Here’s how to interpret it effectively:
BUY Signal:
When the bars rise above the zero line, it shows that bulls are taking control.
Enter long positions and exit short trades.
SELL Signal:
When the bars move below the zero line, it means bears dominate.
Enter short positions and close long trades.
Neutral Phase:
When the bars hover near zero, the market is in consolidation or low momentum.
It’s best to wait for a clear breakout before entering a trade.
💡 Pro Tip: Combine this indicator with moving averages or volume-based indicators for stronger confirmation of entry points.
Why Traders Prefer the Bulls Bear Power Indicator
The reason traders love this indicator is its clarity and simplicity. Unlike complicated algorithms, it provides a clean, visual representation of market sentiment.
Key Benefits:
Works on all currency pairs and assets.
Ideal for Trend Confirmation and momentum analysis.
Helps identify trend reversals early.
Compatible with all MT4 versions.
Excellent for swing and position trading.
Drawbacks:
Not ideal for Scalping on lower timeframes due to noise.
Should be combined with other confirmation tools to reduce false signals.
Best Settings and Tips for Optimal Use
Use it on H1, H4, or Daily charts for more accurate readings.
Apply a 20 or 34 EMA on your chart to align entries with the broader trend.
Avoid trading during high-impact news events, as volatility may distort indicator signals.
Combine with RSI or ADX for additional confirmation of Trend Strength.
Conclusion
In summary, the Bulls Bear Power Indicator for MT4 is a reliable momentum oscillator that clearly shows who’s winning the market battle — the bulls or the bears. It’s easy to read, works across all timeframes, and can help traders make confident buy or sell decisions based on trend strength.
You can download the Bulls Bear Power Indicator for free at IndicatorForest.com and start using it to improve your trading strategy today.
For even more powerful trading tools, check out our article on the Best Momentum Indicators for MT4 to complement your setup.
FAQ
Published:
Nov 11, 2025 21:38 PM
Category: