Dominate the Markets with the Bulls Power V1 Indicator
Trading against the dominant market trend is one of the fastest ways to deplete a trading account. For day traders and scalpers, pinpointing exactly when buyers are losing steam or when a bearish correction is about to reverse back into a bullish rally is crucial. The Bulls Power V1 indicator—popularly integrated into advanced multi-timeframe dashboards like the FFx series by FerruFx—is engineered to give you a transparent, real-time look at the strength of market buyers.
What is the Bulls Power V1 Indicator?
The Bulls Power V1 indicator is a momentum oscillator that quantifies the balance of power between buyers (bulls) and sellers (bears). Originally conceptualized by Alexander Elder, the indicator calculates the difference between the highest price of the current bar and an Exponential Moving Average (EMA), usually set to a 13-period default.
The core math is simple:
$$\text{Bulls Power} = \text{High Price} - \text{EMA}$$
If the high of the candle is well above the moving average, the indicator displays positive value bars, signaling that buyers have strong control over Price Action. If the high falls close to or below the EMA, the indicator drops into negative territory, indicating that sellers are actively suppressing the market.
Multi-Timeframe Dashboard Advantage
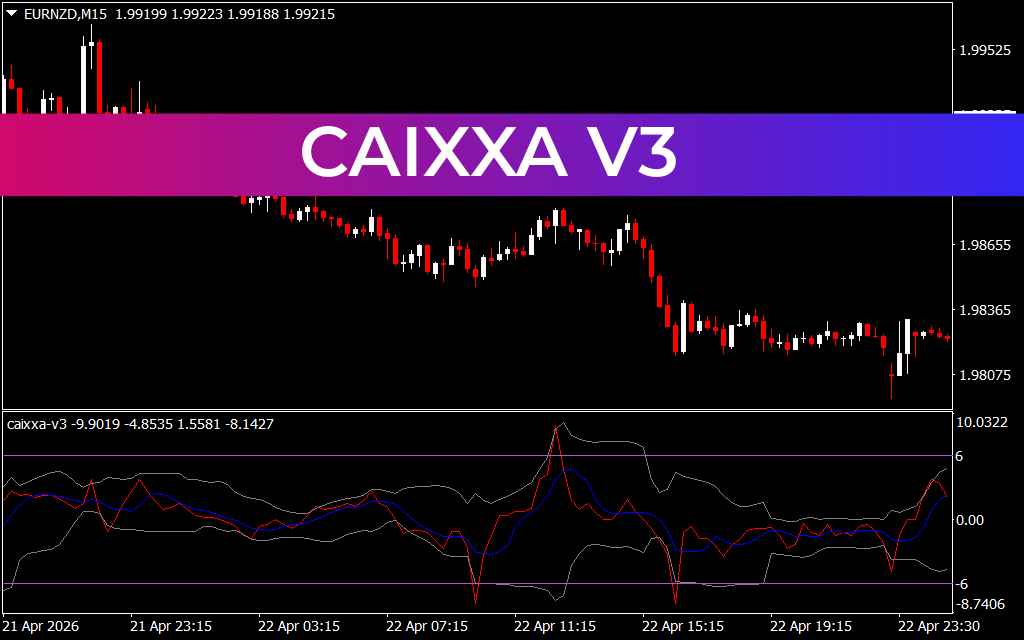
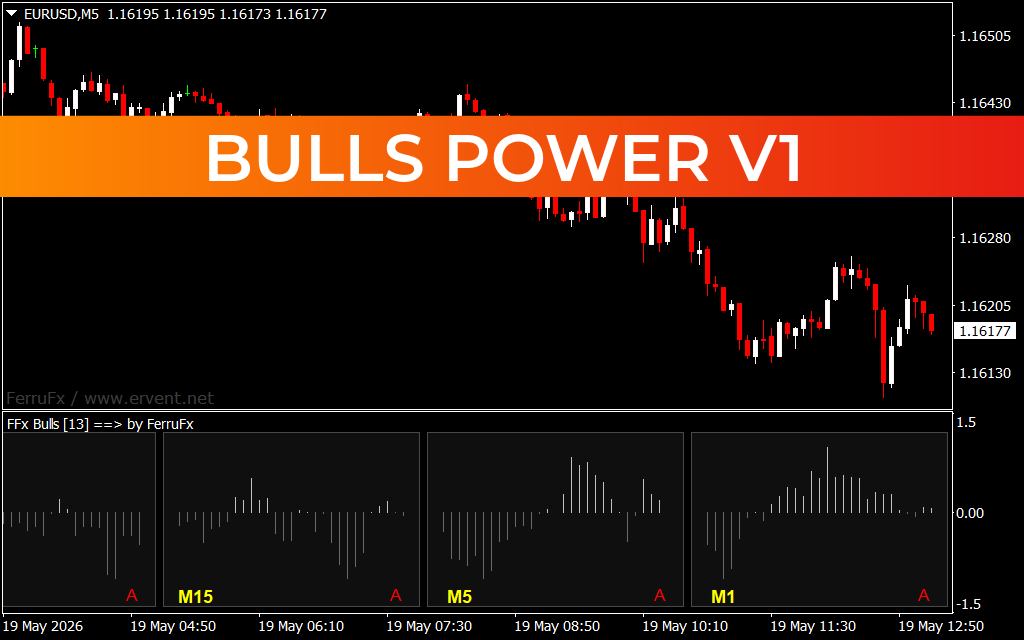
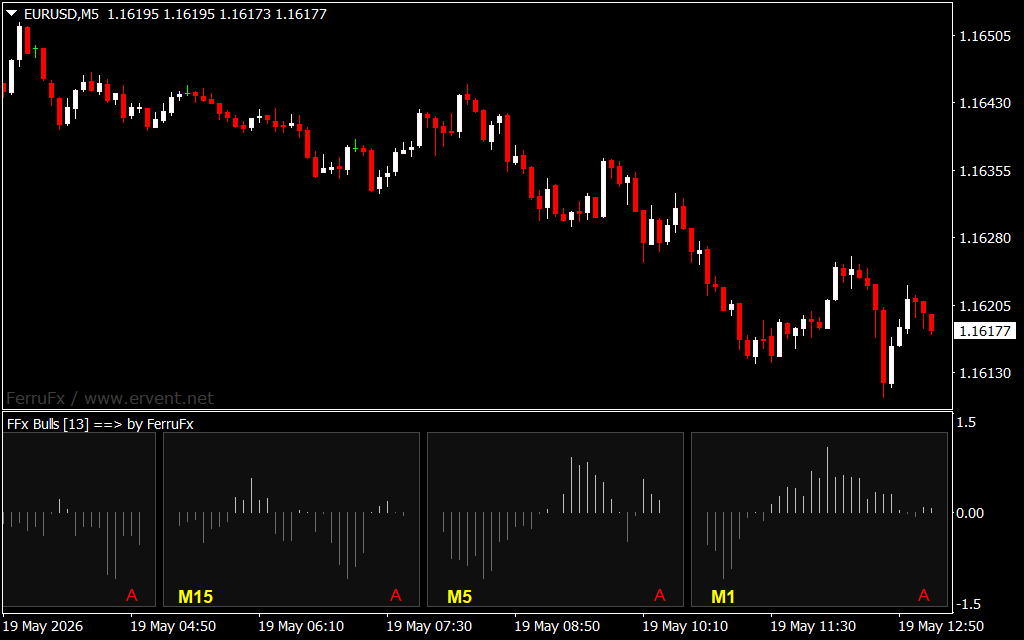
What elevates the V1 version of this tool on platforms like MetaTrader is its multi-timeframe (MTF) panel layout. Instead of cluttering your workspace with multiple charts, the dashboard breaks down buyer momentum across several critical time intervals—such as the 1-minute (M1), 5-minute (M5), and 15-minute (M15) grids—all within a single indicator window.
- Trend Alignment: When the histogram bars across the M1, M5, and M15 panels all line up below the 0.00 center line, it signals an aggressive downward trend. Trying to buy during this period is a low-probability trade.
- Momentum Exhaustion: As visible on lower timeframes like the EUR/USD M5 chart, the indicator tracks the precise moments when selling pressure peaks (long downward histogram spikes) and when those spikes begin to shrink, hinting at an impending bullish bounce.
How to Trade with Bulls Power V1
To utilize the Bulls Power V1 indicator effectively, it should be paired with a directional filter, such as the companion Bears Power indicator or a long-term moving average.
- Bullish Trend Continuity: In an established uptrend, look for the Bulls Power histogram to dip into negative territory and then begin rising back toward the 0.00 zero-line. This contraction indicates a temporary bearish pullback is ending, offering a perfect buy entry.
- Bearish Reversals: If price action prints a higher high but the Bulls Power V1 histogram prints a lower peak, a bearish divergence has formed. This reveals that despite rising prices, the underlying buying force is decaying, signaling a prime shorting opportunity.
Equip your charting platform with the Bulls Power V1 indicator today to unlock institutional-grade clarity on buyer momentum.
1 Download
Last Update:
May 19, 2026 16:11 PM
Published:
Jan 19, 2026 19:42 PM
Category: