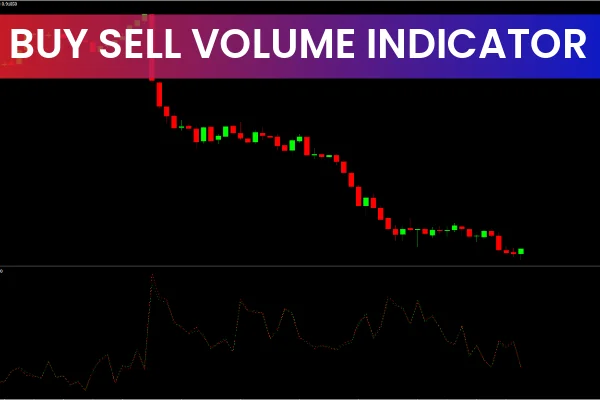
The Buy-Sell Volume Indicator is designed to measure the strength or weakness behind price movements. In live market conditions, traders want to join bullish or bearish moves that show strong underlying volume pressure. Volume is one of the most trusted ways to gauge real market participation.
To complement this tool, traders often pair it with other volume-based indicators such as the Volume MA Indicator and the Percentage Volume Oscillator, which provide extra clarity on momentum and volume shifts.
What Does the Buy-Sell Volume Indicator Do?
The indicator constantly evaluates the balance between bullish volume and bearish volume.
It does not directly give buy or sell signals. Instead, it helps traders:
Filter high-probability setups
Validate breakout strength
Confirm trend continuation
Avoid false breakouts caused by weak volume
It is a volume strength confirmation tool, making it very useful during volatile market phases.
How to Trade Using the Buy-Sell Volume Indicator on MT4
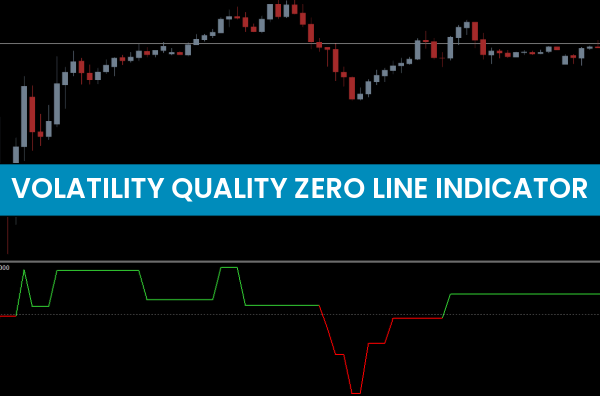
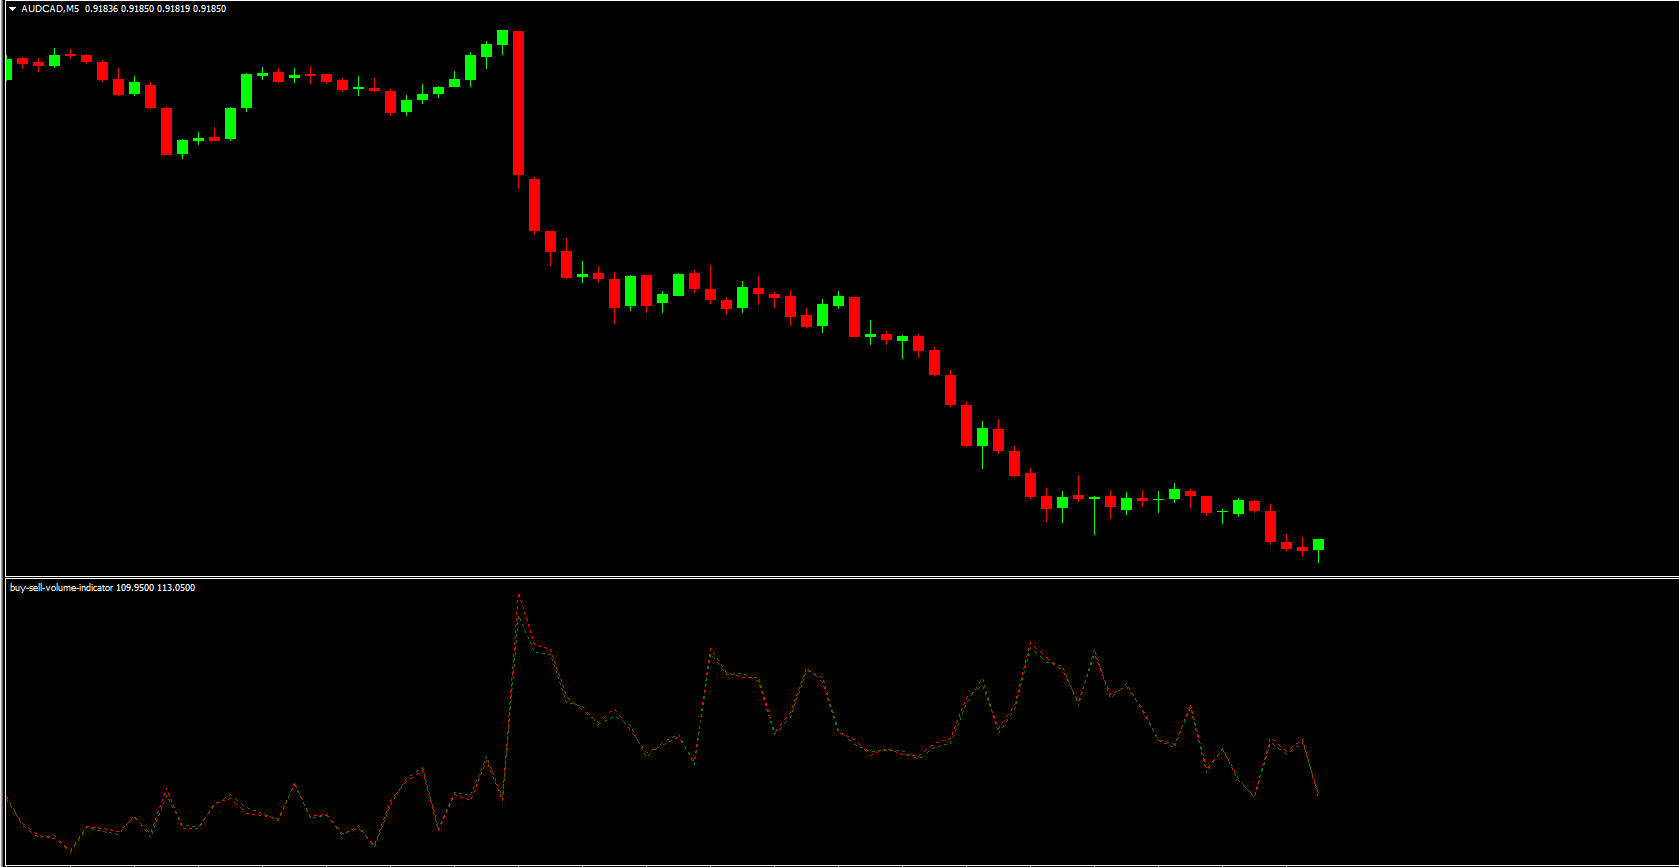
The Buy-Sell Volume tool plots a dotted curve that rises or falls based on volume changes. The color shift is the key:
Green Curve → Volume increasing → Bullish strength
Red Curve → Volume decreasing → Bearish weakness
These color and slope changes help determine whether a move has real momentum behind it.
Using the Indicator for Breakout Trading
In the example highlighted (EURUSD M15):
The price was consolidating after an earlier bullish trend.
The Buy-Sell Volume curve also remained compressed, waiting for expansion.
When price attempted a bullish breakout, the volume curve spiked above the consolidation range and turned green.
This confirmed that the breakout had strong buy pressure behind it.
This approach helps avoid many false breakouts. A rising green volume curve means the market has real participation, giving a trader confidence to enter.
Filtering Sell Setups
For bearish opportunities:
Ensure the indicator curve is red
Confirm that the curve is falling consistently
Enter on bearish breakouts only when volume accompanies the move
This prevents early or weak entries that lack true market momentum.
Using the Indicator for Trend-Following Trades
The Buy-Sell Volume Indicator is also valuable during trending markets:
In a bullish trend, wait for higher-lows
When price prepares to continue the trend, the indicator usually turns green and rises
This indicates renewed buying pressure
Similarly, during downtrends, a falling red curve confirms strong selling pressure.
Bottom Line
The Buy-Sell Volume Indicator for MT4 is an excellent tool for identifying:
Breakout confirmation
Trend Continuation strength
Bullish vs bearish volume imbalance
Market momentum pressure
When combined with Price Action, support/resistance, or other volume indicators like Volume MA or Percentage Volume Oscillator, it creates a highly reliable confirmation system.
FAQ
1 Download
Published:
Dec 05, 2025 12:48 PM
Category: