Mastering Intraday Geometry with Camarilla Pivot Points
Day trading highly liquid currency pairs like the EUR/USD requires an objective, mathematical map of Market Structure. On the 15-minute (M15) chart, price action constantly transitions through different volatility regimes, switching from tight consolidation boundaries to sharp expansion vectors. Without clear structural boundaries, retail traders frequently get caught chasing price at the absolute top of a range or selling at the absolute floor.
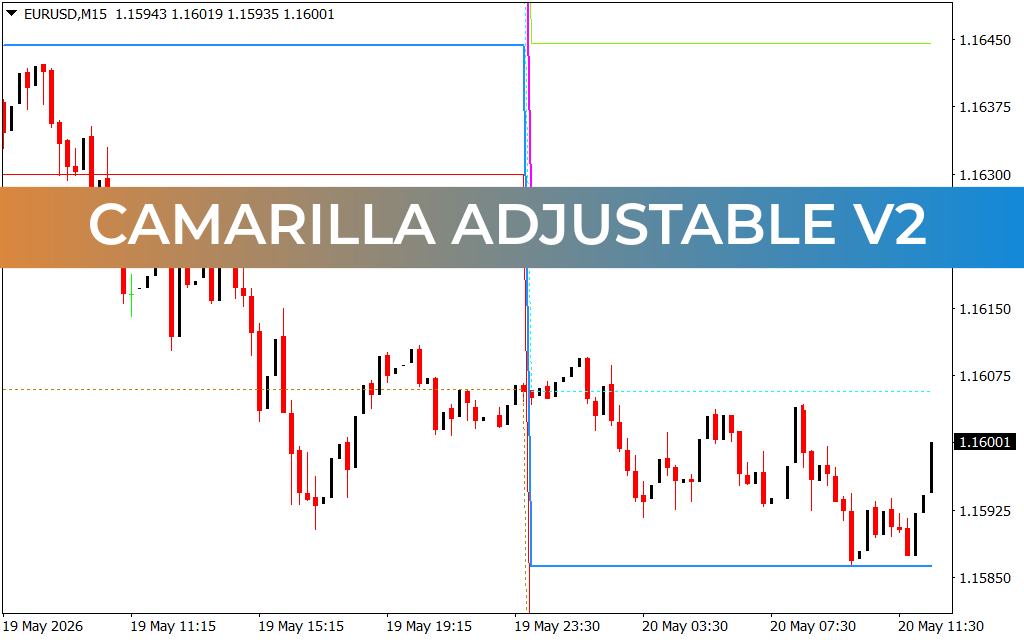
Looking closely at the Price Action from May 19th to May 20th, the EUR/USD exhibited a prominent markdown phase, breaking down from local distribution areas to establish a structural low near 1.15850. Following this liquidity hunt, the asset began to compress, forming a distinct horizontal accumulation channel. To navigate these micro-trends with institutional precision, mechanical mathematical modeling is required. This is precisely where the predictive nature of Camarilla pivot points changes the game.
The Power of Automated Symmetrically-Weighted Levels
The technical configuration laid out across this session illustrates the power of the Camarilla Adjustable V2 indicator. Derived directly from the previous session's true range (High, Low, and Close), the Camarilla mathematical formula applies specific fixed multipliers to plot highly precise intraday Support And Resistance lines. Unlike standard floor pivots, Camarilla levels are packed tighter around the session open, making them incredibly reactive to intraday volatility:
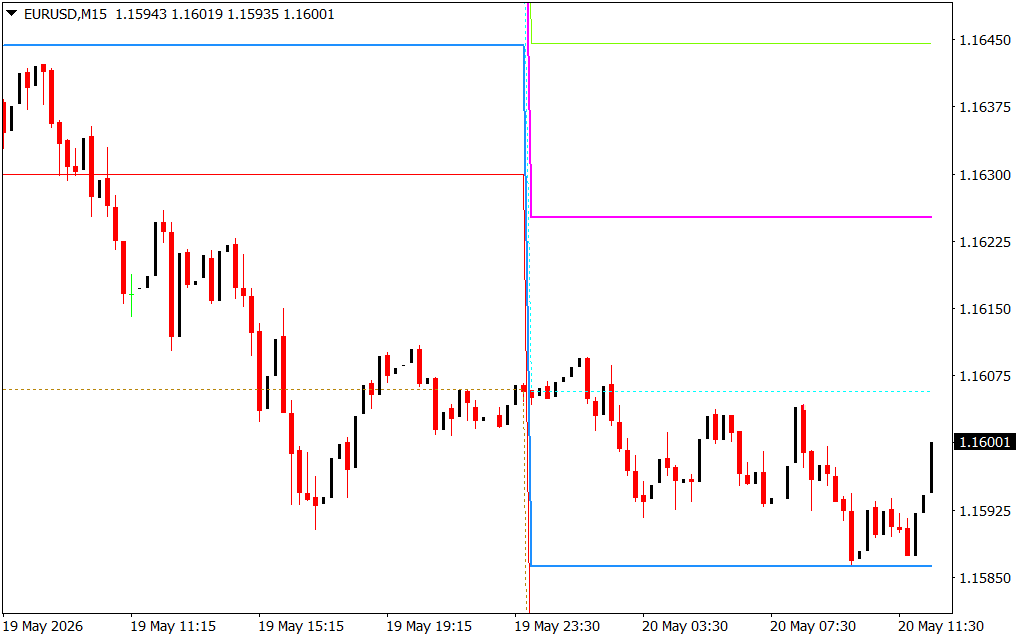
- The Reversal Zone (S3 / R3): The S3 (Support 3) and R3 (Resistance 3) boundaries represent the ultimate mean-reversion zones. When the EUR/USD dips to the lower S3 parameter, it flags extreme seller exhaustion, indicating a prime area to look for sharp, V-shaped counter-trend reversals back toward the central mean.
- The Breakout Trigger (S4 / R4): The outer S4 and R4 lines act as institutional breakout thresholds. If a high-volume candlestick closes cleanly beyond the S4 support or R4 resistance line, it confirms that the consolidation phase has ended, triggering an explosive momentum continuation trade along the path of institutional order flow.
By visualizing these automated target and stop-placement levels in real-time, traders can systematically eliminate subjective bias from their technical workflow.
Optimizing Your Platform for High-Velocity Execution
Manually calculating mathematical formulas across changing sessions introduces operational errors and mental lag. Utilizing an advanced adjustable script plots these critical horizontal layers across your charts instantly, leaving you free to focus purely on order execution. The customizable framework allows you to adapt line widths, toggle individual level visibility, and fine-tune alerts. Integrating this robust technical analysis overlay into your MetaTrader infrastructure provides an undeniable competitive edge—allowing you to pinpoint institutional turning points and scale your trading portfolio with total confidence.ex trading strategy today.
1 Download
Last Update:
May 20, 2026 15:45 PM
Published:
Jan 18, 2026 19:17 PM
Category: