Decoding Market Momentum: How to Trade with Candle Strength
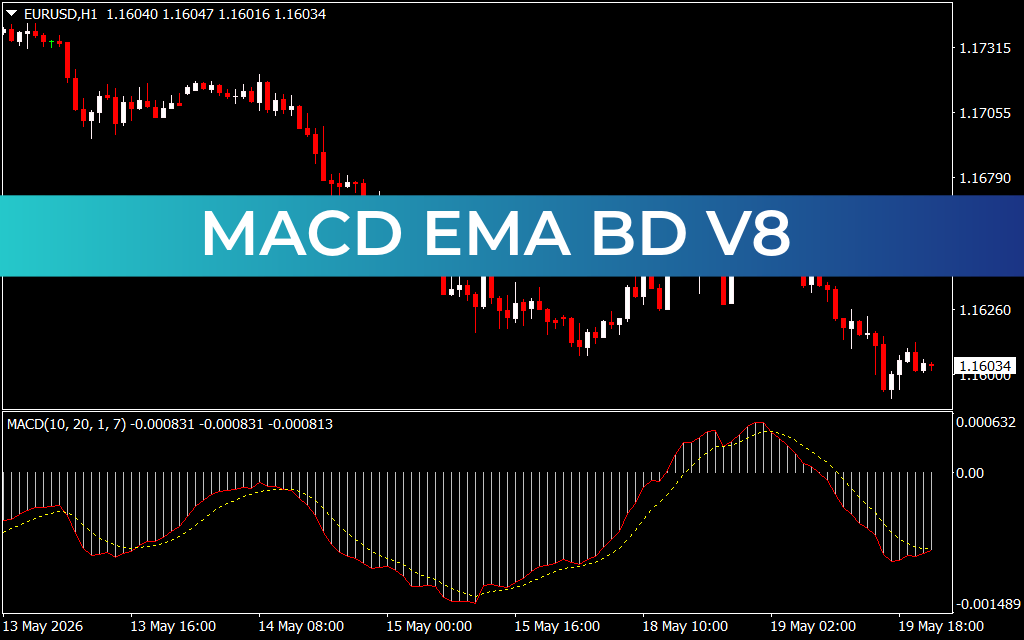
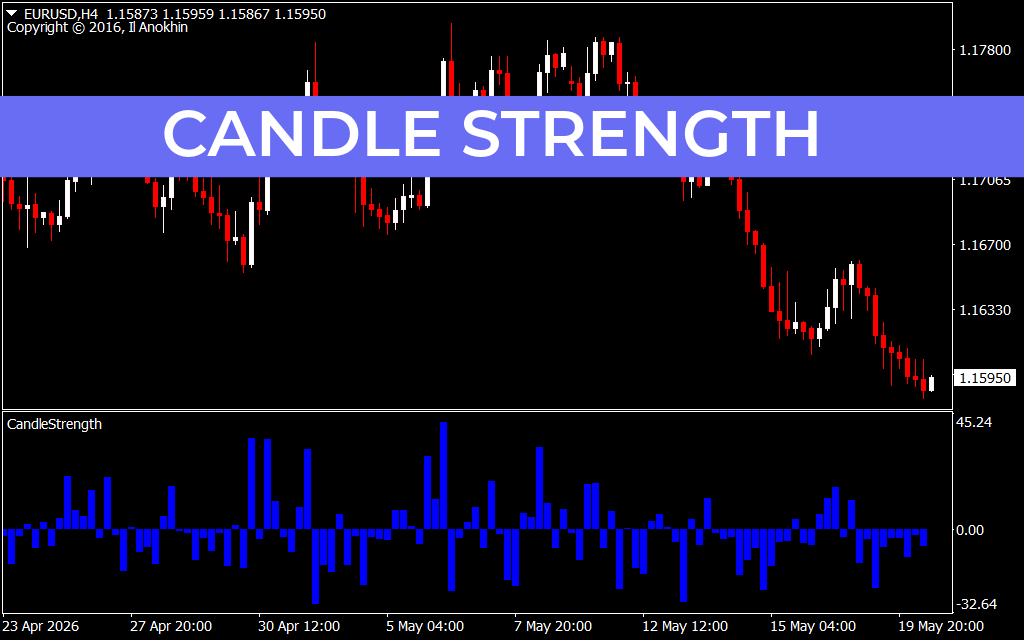
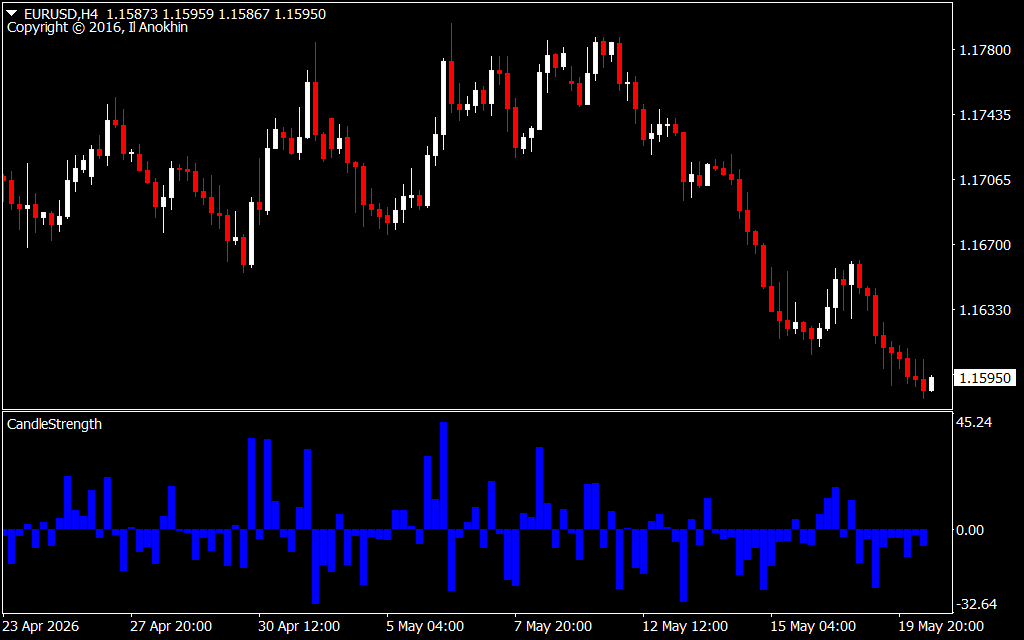
In the fast-paced world of Forex trading, understanding market momentum is the difference between a winning strategy and a blown account. While standard price charts show where the market has been, they often mask the underlying velocity of the move. Traders viewing the EUR/USD 4-hour (H4) chart can easily see the recent aggressive markdown from the 1.17800 resistance level down to the 1.15950 structural support. However, reacting to a trend after it has already moved significantly leaves retail traders highly vulnerable to late entries and sudden reversals.
To gain a statistical edge, professional traders look beneath the surface of simple candlestick patterns using institutional volume and momentum metrics. This is exactly where measuring internal candle strength becomes an invaluable component of a modern trading toolkit.
The Power of Quantifying Market Velocity
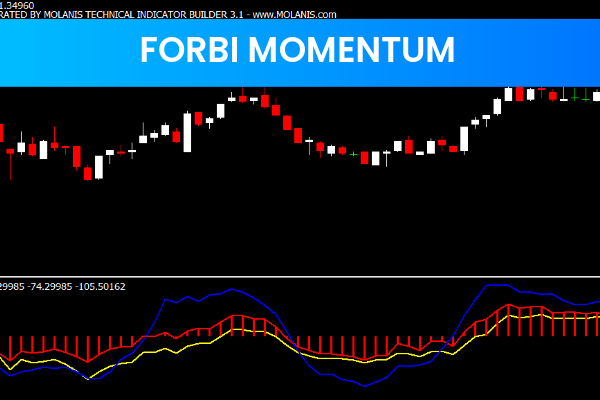
The custom indicator featured at the bottom of the H4 chart provides an objective, mathematical breakdown of price expansion. Unlike lagging indicators such as standard moving averages, a real-time strength histogram analyzes the relationship between raw volume, true range, and close proximity to highlight institutional accumulation or distribution.
When reviewing this EUR/USD setup, the value of this analysis becomes perfectly clear:
- Spotting Valid Breakouts: As the pair broke below key intermediate support levels around mid-May, the indicator printed consistently growing negative blue bars, confirming strong institutional backing behind the bears.
- Identifying Trend Exhaustion: As price approaches the 1.15950 floor on May 19th, note how the bearish bars begin to diminish in size despite price continuing to edge lower. This divergence suggests selling pressure is drying up, flagging a high-probability zone for a counter-Trend Reversal or a healthy market retracement.
By filtering market noise through a momentum lens, traders can decisively ignore weak, low-volume breakouts that typically result in painful fakeouts.
Enhancing Your Technical Analysis Workflow
Relying solely on visual candlestick formations leaves too much room for subjective error. A candle that "looks" strong on an H4 chart might actually be completely hollow when evaluated against true tick volume and transactional velocity.
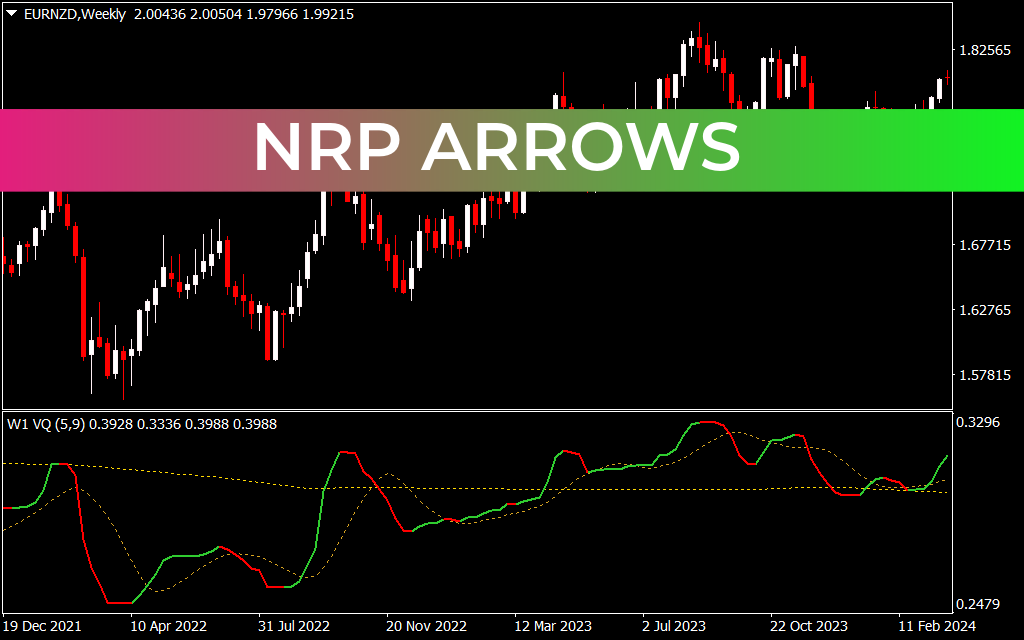
Integrating an automated, algorithmic Momentum Indicator into your MetaTrader platform standardizes your rules for execution. It allows you to systematically measure buyer vs. seller dominance on any timeframe, ensuring you only take trades aligned with institutional order flow. Whether you are a swing trader tracking structural H4 trends or a day trader hunting for intraday reversals, quantifying raw strength is the ultimate way to refine your risk management and boost your win rate.
2 Downloads
Last Update:
May 20, 2026 15:34 PM
Published:
Jan 18, 2026 19:35 PM
Category: