The CCI Arrows Indicator for MT5 is a powerful momentum-based trading tool built on the Commodity Channel Index (CCI). It automatically plots colored arrows on the chart to highlight potential buy or sell opportunities whenever the CCI confirms strong bullish or bearish momentum. Because of its simplicity and high responsiveness, it is suitable for both novice and experienced traders looking to improve market timing and trade with the prevailing trend.
Originally developed by Donald Lambert, the CCI measures the deviation of price from its statistical average. The CCI Arrows Indicator enhances this by visually marking important CCI events, making it easier to identify tradeable moments during trending markets.
How the CCI Arrows Indicator Works
The indicator analyzes market momentum through the standard CCI calculation and generates signals based on two key thresholds:
+100 level — indicates bullish strength
–100 level — indicates bearish strength
When these levels are crossed, the indicator displays an arrow directly on the chart:
Blue arrow (buy signal) → CCI crosses above +100
Red arrow (sell signal) → CCI crosses below –100
These arrows help traders quickly interpret momentum changes without having to visually inspect the CCI line in a separate window.
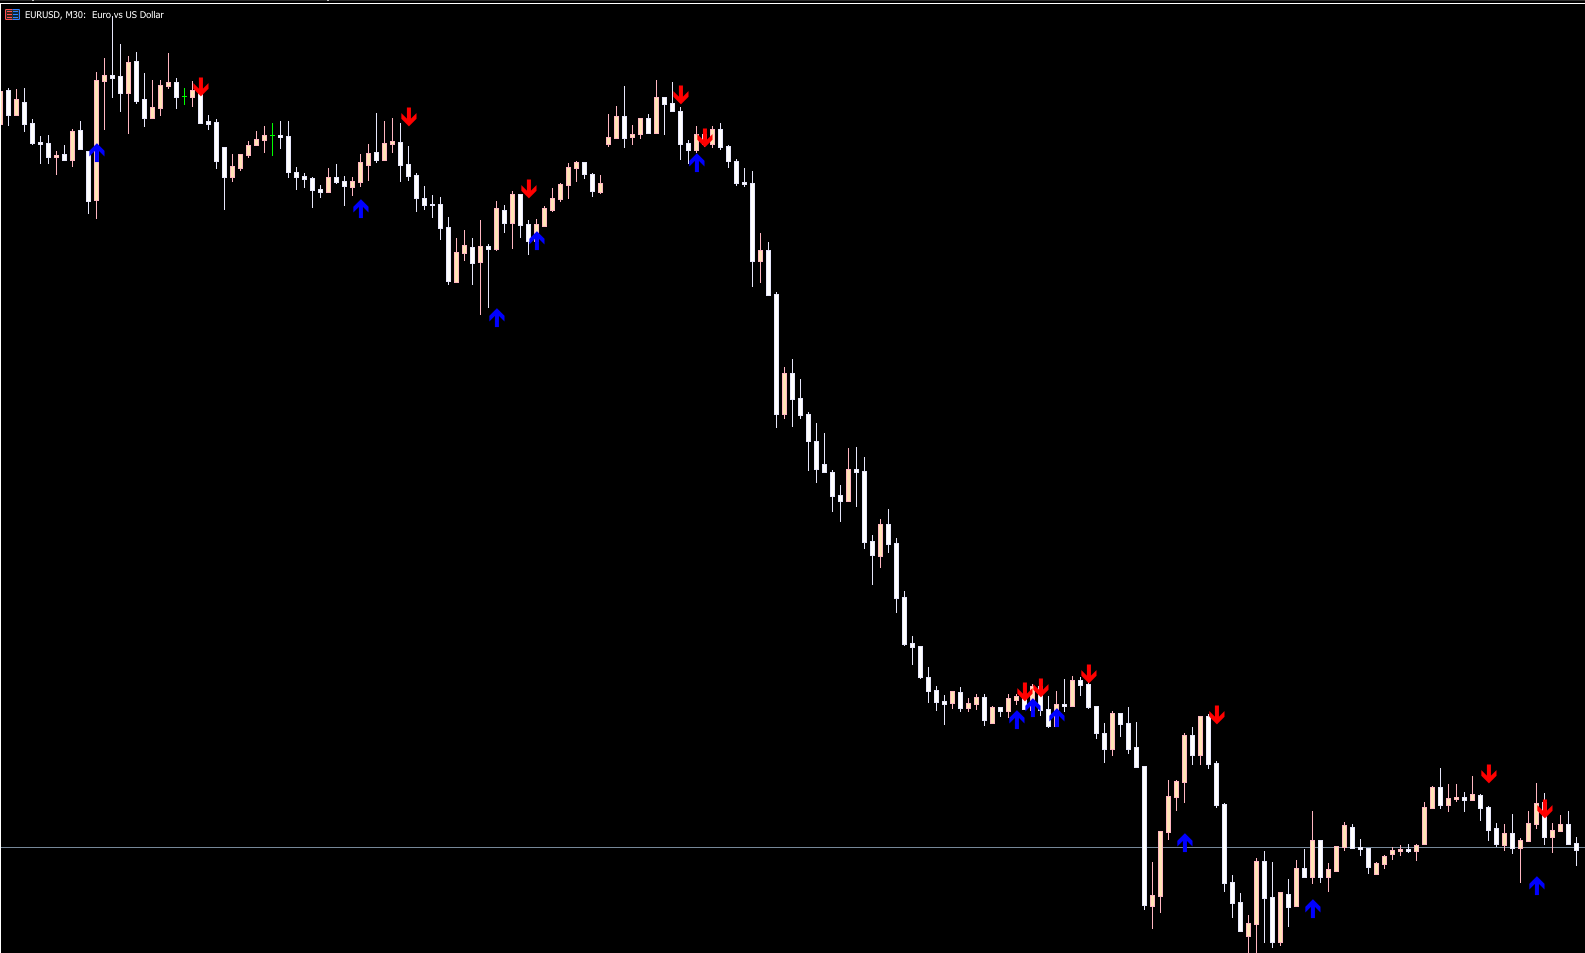
CCI Arrows for MT5 Buy/Sell Signals
The chart display (as seen in the example image) features clean, straightforward arrows that represent CCI-triggered entries:
Buy Signals
A blue arrow appears when:
The CCI crosses above +100, confirming bullish momentum
Price rejects support or completes a minor pullback within a larger uptrend
This suggests traders should consider entering a long position.
Sell Signals
A red arrow appears when:
The CCI drops below –100, confirming bearish strength
Price pulls back into resistance or resumes movement in a downtrend
This suggests an opportunity to enter a short position.
How to Trade Using the CCI Arrows Indicator
While the arrows themselves provide the entry signals, traders can increase accuracy by applying the following rules:
Trade With the Trend
Always align your trades with the dominant market direction.
For example:
Take blue buy arrows in an uptrend
Take red sell arrows in a downtrend
Avoid counter-trend trades unless used as part of a reversal strategy.
Use Higher Timeframes for Confirmation
A multi-timeframe approach improves reliability:
Signal timeframe: M1–M30 (for scalpers and day traders)
Confirmation timeframe: H1 or H4
If the higher timeframe confirms the same direction, the probability of success increases.
Combine With Other Technical Indicators
The CCI Arrows work exceptionally well with:
Moving averages (50, 100, 200)
Trendlines and Market Structure
Support And Resistance zones
RSI or Stochastic for oversold/overbought filtering
Volume indicators
This helps filter out false signals during consolidation phases.
Manage Risk Properly
Recommended risk practices:
Stop-loss placed below/above pullback structure
Take profit at recent highs/lows
Adjust SL to break-even after momentum confirms continuation
Who Should Use the CCI Arrows Indicator?
This MT5 indicator is ideal for:
Scalpers (fast entries after momentum spikes)
Day traders (trend continuation trades)
Intraday swing traders
Trend-following systems
Anyone who prefers clean, visual signals
Because it works on multiple timeframes, it adapts well to different trading styles and market conditions.
Conclusion
The CCI Arrows Indicator for MT5 is a simple yet effective tool that provides clear visual buy and sell signals based on the powerful Commodity Channel Index. By plotting arrows at key momentum levels, it helps traders identify optimal entry zones during strong market trends. Whether you're Scalping, day trading, or swing trading, this indicator offers a reliable method for timing entries—especially when combined with broader trend analysis and supporting indicators.
You can download the CCI Arrows Indicator for MT5 for free from IndicatorForest.com and integrate it into your trading strategy today.
FAQ
4 Downloads
Published:
Nov 15, 2025 01:14 AM
Category: