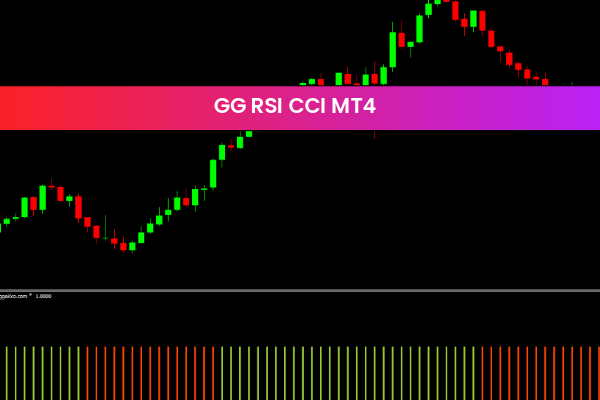
CCI Histogram MT4 Indicator Overview
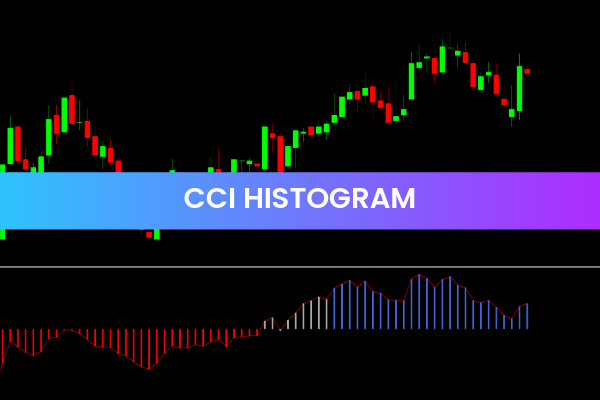
The CCI Histogram MT4 Indicator is an enhanced version of the classic Commodity Channel Index (CCI) designed to provide a clear visual representation of market conditions. Instead of a traditional line, this indicator displays a color-coded histogram, making it easier for traders to identify trend direction and momentum at a glance.
By highlighting bullish, bearish, and neutral phases, the indicator helps traders eliminate subjectivity and improve decision-making. Additionally, it allows traders to detect early trend reversals using divergence, making it a powerful momentum and reversal tool.
How the CCI Histogram Indicator Works
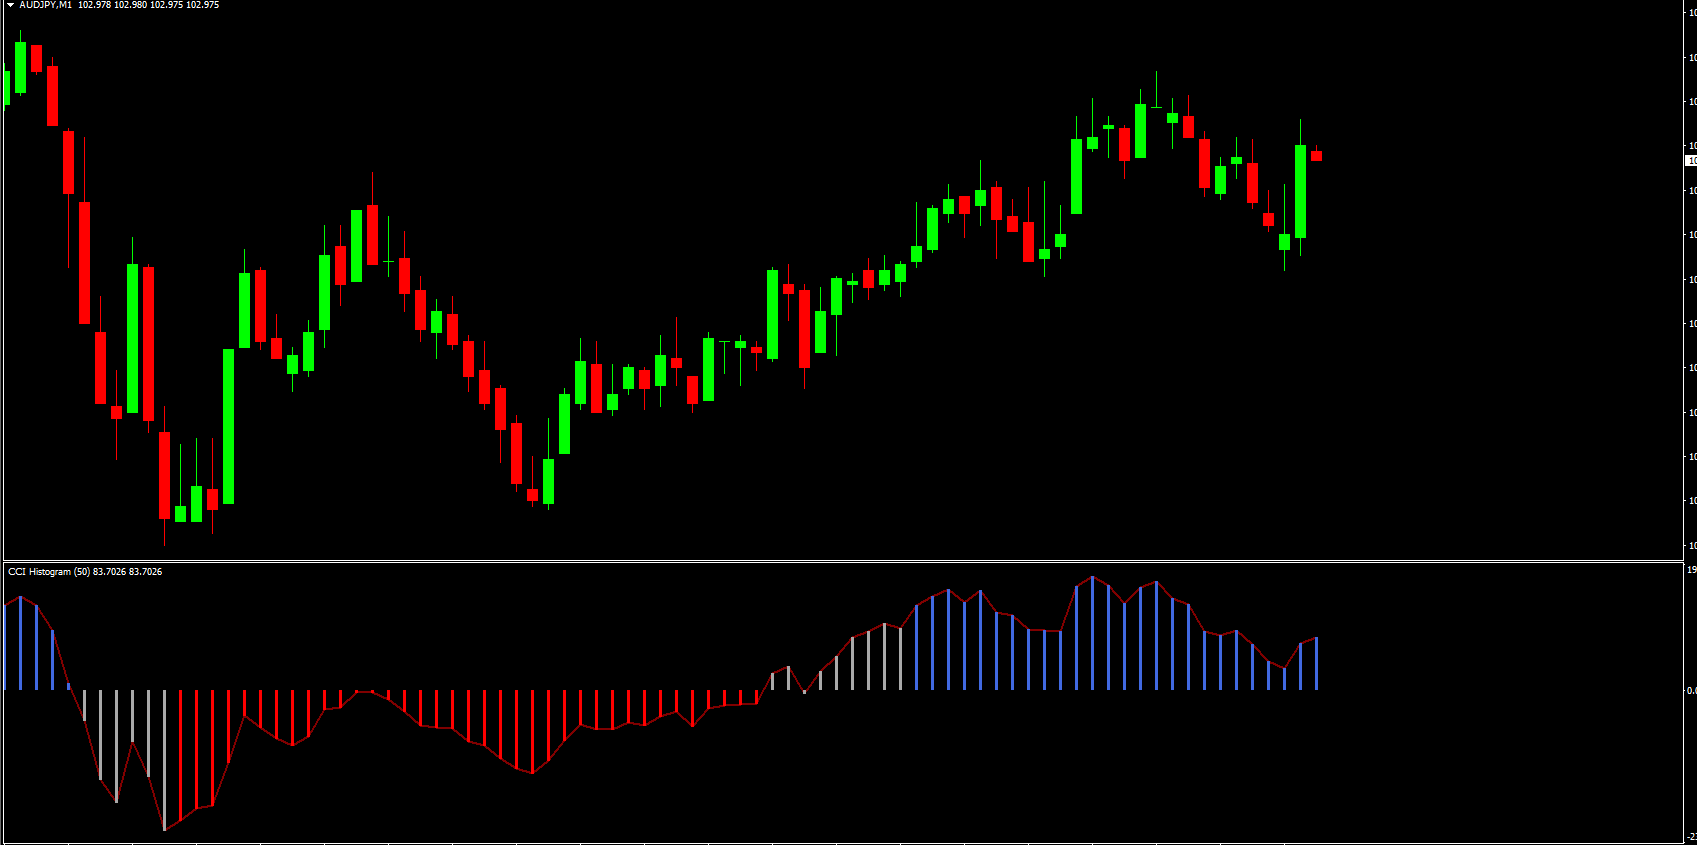
The indicator analyzes price momentum using CCI values and translates them into colored histogram bars:
Blue Bars: Bullish market condition
Gray Bars: Neutral or consolidating market
Red Bars: Bearish market condition
Key CCI levels:
Above +100: Strong bullish momentum
Below −100: Strong bearish momentum
Traders are advised to ignore weak signals between −100 and +100 and focus on trades that align with clear trend strength.
Features of the CCI Histogram MT4 Indicator
Color-Coded Histogram: Instantly identify trend direction
Three Market Conditions: Bullish, bearish, and neutral detection
Divergence Detection: Identify potential trend reversals early
Clear Momentum Readings: Eliminates unnecessary chart clutter
Multi-Timeframe Compatible: Works on all chart timeframes
Beginner-Friendly Interface: Easy to interpret visual signals
Trading Strategies Using CCI Histogram
Trend-Following Strategy
Enter buy trades when blue bars appear above +100
Enter sell trades when red bars appear below −100
Exit trades when the histogram turns gray or changes color
Divergence Strategy
Bullish divergence: Price makes lower lows while histogram makes higher lows
Bearish divergence: Price makes higher highs while histogram makes lower highs
A bullish divergence above the −100 level or a bearish divergence below +100 strengthens reversal trade setups.
Benefits of the CCI Histogram Indicator
Clear Trend Identification: No need for manual trend analysis
Early Reversal Signals: Divergence highlights potential turning points
Reduced Market Noise: Filters out weak and choppy conditions
Suitable for All Traders: Ideal for beginners and advanced traders
Versatile Usage: Works for Scalping, day trading, and swing trading
Final Thoughts
The CCI Histogram MT4 Indicator is a powerful momentum tool that simplifies trend analysis by displaying three distinct market conditions through color-coded histograms. Its ability to detect divergence and strong momentum zones makes it highly effective for identifying both Trend Continuation and reversal opportunities.
Whether used as a stand-alone indicator or combined with Price Action or trend-based tools, the CCI Histogram is a valuable addition to any Forex trading strategy.
FAQ
CCI Histogram displays the Commodity Channel Index as a histogram, making it easier to visualize CCI momentum and changes. It helps identify overbought/oversold conditions and potential reversal points.
The histogram format makes CCI momentum changes more visible, shows the rate of change in CCI values, helps identify when momentum is accelerating or decelerating, and provides clearer visual signals than line displays.
Histogram bars above zero suggest bullish momentum, bars below zero indicate bearish momentum, increasing bar size shows strengthening momentum, and decreasing bar size suggests weakening momentum.
Trade histogram crossovers above/below zero, use extreme readings for overbought/oversold trading, trade momentum changes when bar size changes significantly, and combine with trend indicators for direction confirmation.
Histogram display makes momentum changes more visible, provides clearer visual signals, helps identify momentum acceleration/deceleration, and makes it easier to spot trading opportunities compared to line displays.
5 Downloads
Published:
Dec 17, 2025 09:34 AM
Category: