Master Market Momentum with the CCI Histogram Volume Indicator
In the competitive landscape of Forex trading, identifying the strength of a trend before it exhausts is a primary challenge. Standard indicators often provide a one-dimensional view of the market, focusing either on price velocity or volume independently. The CCI Histogram Volume indicator for MetaTrader is a professional-grade technical tool that bridges this gap, combining the momentum-tracking power of the Commodity Channel Index (CCI) with integrated volume analysis to provide a high-signal trading environment.
The Logic of CCI Histogram Volume
The Commodity Channel Index (CCI) was originally developed to identify cyclical turns in commodities, but it has since become a staple for Forex traders looking for overbought and oversold conditions. The CCI Histogram Volume evolution takes this a step further by transforming the traditional oscillator line into a dynamic histogram.
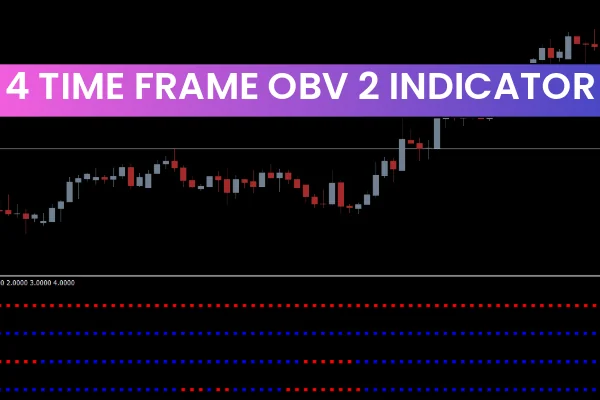
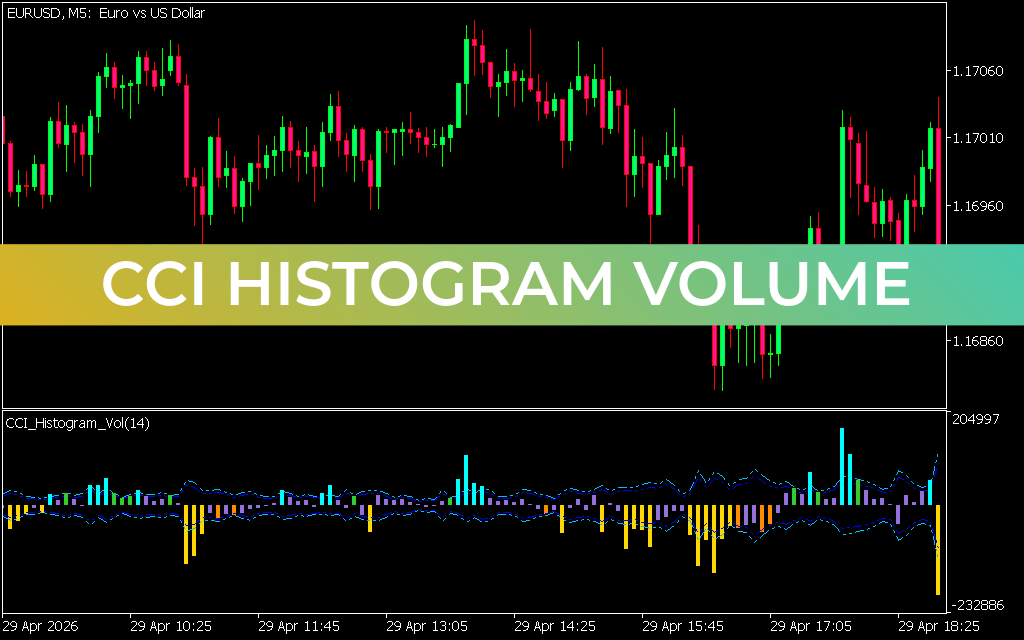
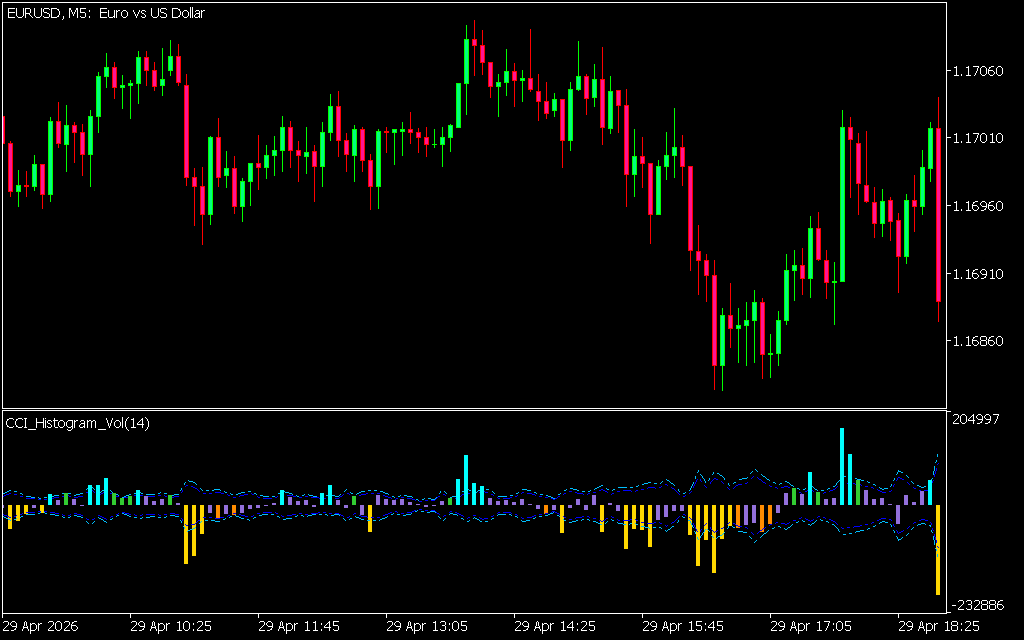
As seen on the EUR/USD M5 chart, this indicator sits in a dedicated sub-window. The histogram bars fluctuate above and below a zero-level median. The integration of "Volume" logic ensures that the height and color of the bars aren't just based on price deviation, but also on the conviction of market participants. This helps traders distinguish between a high-momentum trend supported by "smart money" and a weak price spike that is likely to fail.
Key Features and Strategic Advantages
- Visual Trend Confirmation: The indicator provides an instant psychological map of the market. Green bars above the zero line indicate a healthy bullish momentum, while red bars below the zero line signal dominant bearish pressure.
- Integrated Volume Filtering: Unlike standard CCI, which can be erratic, the Histogram Volume version smooths out the noise. It highlights "high-conviction" moves where price and volume are in sync, allowing you to avoid "fakeouts" during low-liquidity sessions.
- Precision Divergence Tracking: One of the most powerful uses of the CCI Histogram is identifying divergence. If price makes a new high but the histogram bars are shorter than the previous peak, it signals a "hidden" weakness in the trend, warning you of an imminent reversal.
- Zero-Line Crossover Signals: The zero line acts as the market's equilibrium. A transition from red to green (or vice-versa) marks a shift in the balance of power, providing a definitive entry trigger for trend-following strategies.
- Optimized for Scalping: On the M5 and M15 timeframes, intraday noise is prevalent. The CCI Histogram Volume acts as a stabilizer, helping scalpers identify the true direction of the intraday flow.
Trading with the CCI Histogram
The most effective strategy involves using the histogram as a momentum filter. For example, if your primary price-action strategy suggests a "buy," you look at the CCI Histogram Volume for confirmation. If the histogram is producing rising green bars, the probability of a successful trade increases exponentially.
Additionally, the extremes of the histogram serve as "exhaustion" markers. When the bars reach historical peak heights and begin to recede toward the zero line, it is often the ideal time to take profits or move stop-losses to break even.
Conclusion
Success in modern trading requires tools that offer multi-dimensional insights. The CCI Histogram Volume indicator provides the structural clarity needed to understand not just where the price is going, but how much force is behind the move. By integrating momentum and volume into a single visual guide, it empowers you to trade with the confidence of an institutional professional. Elevate your technical analysis today and master the market flow by adding this essential tool to your MetaTrader toolkit.
8 Downloads
Last Update:
May 09, 2026 21:46 PM
Published:
Jan 24, 2026 20:37 PM
Category: