Master Trend Cyclicity: Ultimate Guide to the CCI Step Channel Indicator
In modern financial markets, identifying when an asset is shifting from a quiet consolidation phase into an aggressive, trending impulse is critical to a trader's success. Traditional oscillators like the standard Commodity Channel Index (CCI) do an excellent job of measuring price deviations from a statistical mean to highlight cyclical momentum. However, in highly volatile or choppy markets, a standard oscillator can fluctuate wildly around its zero line, triggering a frustrating sequence of false signals and premature entries.
To smooth out this mathematical turbulence, institutional-grade developers created the CCI Step Channel indicator. By filtering raw momentum calculations through a step-based channel framework, this advanced tool eliminates minor intraday market noise and exposes high-probability structural trend legs.
What is the CCI Step Channel Indicator?
The CCI Step Channel is a premium momentum oscillator designed specifically for MetaTrader platforms. It takes the classic, core principles of the Commodity Channel Index—tracking how far an asset's price has deviated from its average—and maps those fluctuations using a step-filtered mathematical grid.
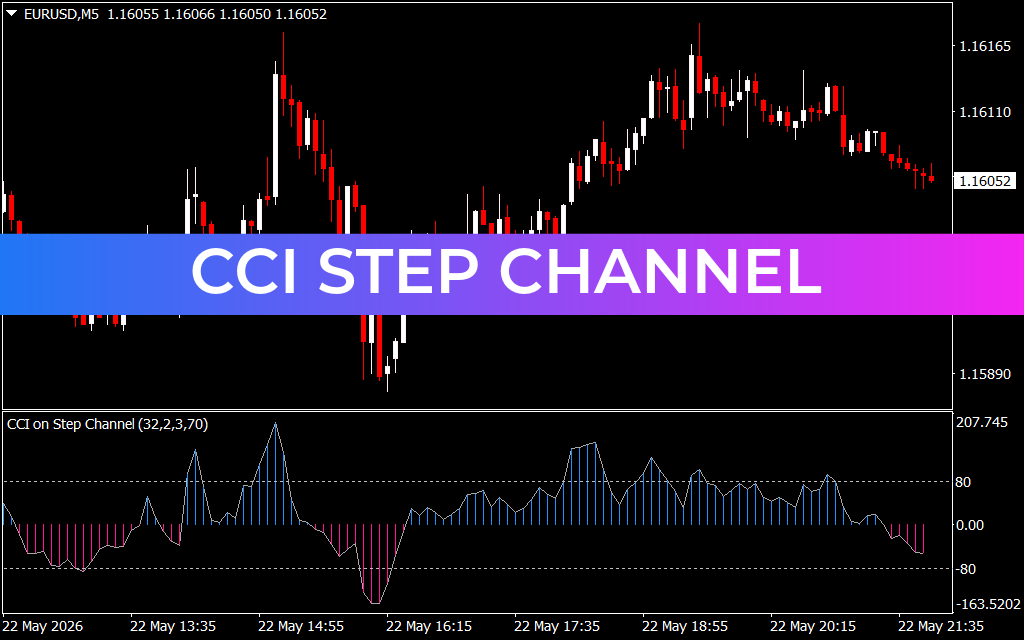
As displayed in the EUR/USD 5-minute (M5) chart above, the system outputs an incredibly clean, histogram-based signal wave (CCI on Step Channel) in a dedicated sub-window beneath the candlesticks. Instead of rendering a single chaotic line, this indicator fills the oscillator space with clear, color-coded vertical bars that fluctuate above and below a central zero equilibrium line. The layout utilizes distinct tracking boundaries (such as the 80 and -80 extreme thresholds) to help traders visualize when momentum is truly shifting.
Key Features and Strategic Advantages
- Advanced Step-Filtering Engine: Filters out insignificant fractional price spikes, ensuring that visual signals are only generated by valid market volume.
- Intuitive Color Mapping: Features a highly legible histogram layout (vibrant blue bars for bullish momentum and deep magenta bars for bearish control) for instant market assessment.
- Objective Overbought & Oversold Limits: Clear horizontal threshold markers make it simple to see when buyers or sellers have pushed the market to an unsustainable extreme.
- Multi-Timeframe Versatility: Seamlessly adapts to any trading style, giving intraday scalpers on the M5 chart the exact same structural clarity that daily swing traders enjoy.
How to Trade with CCI Step Channel
Integrating this dynamic histogram oscillator into an active technical layout simplifies your mechanical trade execution rules:
- The Zero-Line Momentum Switch: A clean transition where the histogram bars flip from magenta to blue while crossing above the zero axis signals an institutional shift into upward momentum (Buy Setup). Conversely, when the bars drop below zero and turn magenta, downside momentum is taking control (Sell Setup).
- Boundary Exhaustion & Mean Reversion: When the histogram surges past the outer 80 or -80 boundary bands, the market is entering a highly overextended state. If the bars begin stepping back toward the zero axis after piercing these zones, it signals a high-probability mean-reversion opportunity or a sharp Trend Reversal phase.
To achieve an exceptional win rate, combine these automated histogram pivots with higher-timeframe trend filters, horizontal Support And Resistance levels, or volume profiles.
1 Download
Last Update:
May 24, 2026 02:52 AM
Published:
Jan 15, 2026 19:02 PM
Category: