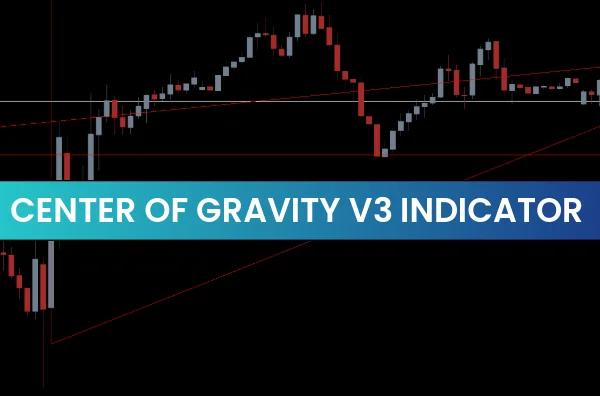
The Center of Gravity V3 Indicator for MT4 is a powerful technical tool designed to identify overbought and oversold conditions in forex trading. By plotting a series of dynamic bands along with a central green line—known as the “center of gravity”—the indicator anticipates that price will revert to this middle line after reaching extreme levels. This makes it an effective reversal-based indicator suitable for both beginners and advanced forex traders.
The indicator’s foundation is simple: when price reaches extreme upper levels, it is considered overbought and expected to fall. When it reaches extreme lower levels, it is oversold and expected to rise. Traders can use these levels to predict bullish or bearish market reversals and place BUY or SELL trades accordingly.
How the Center of Gravity V3 Indicator Works
The indicator draws multiple colored zones on the chart:
RED zone – Overbought area
BLUE zone – Oversold area
GRAY lines – Extreme boundary levels
GREEN line – Center of Gravity (reversion target)
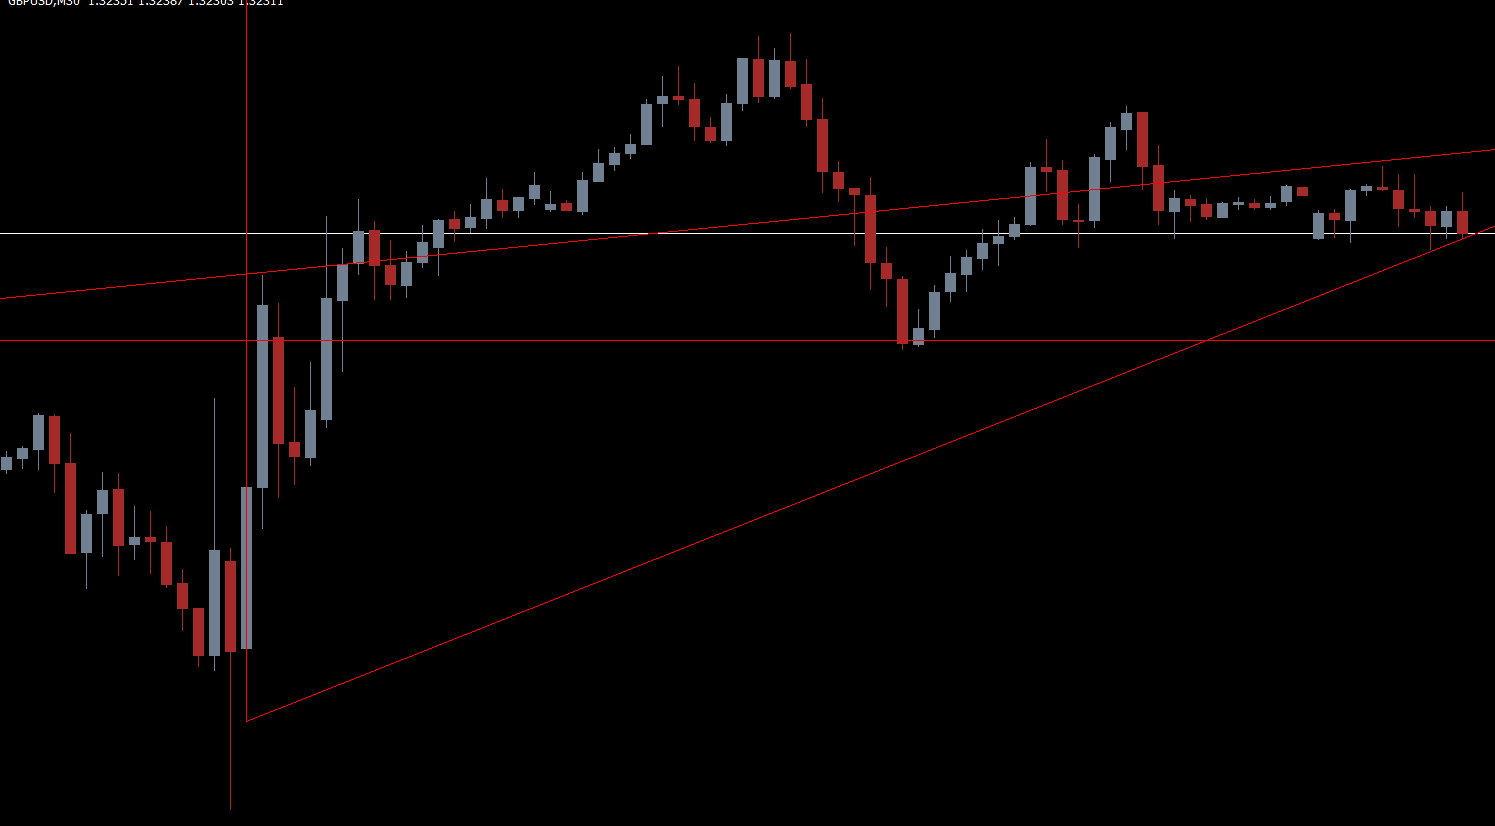
When price moves too far away from the green center line and touches the extreme zones, the indicator anticipates a reversion toward the middle. This makes trade entries and exits highly structured and predictable.
Trading Signals with Center of Gravity V3
The AUDUSD H1 example shows how the indicator identifies high-probability reversal zones.
BUY Signal (Oversold Zone)
A BUY setup occurs when:
Price falls below the lower GRAY line
Price enters or touches the BLUE oversold zone
Market conditions show exhaustion
At this point, traders can open a BUY position and set:
Stop Loss: Below previous swing low
Take Profit: GREEN center-of-gravity line
Because price is naturally expected to revert to equilibrium, the green line becomes an ideal TP target.
SELL Signal (Overbought Zone)
A SELL signal appears when:
Price rises above the upper GRAY line
Price touches the RED overbought zone
Market shows signs of slowing bullish momentum
A SELL entry uses:
Stop Loss: Above previous swing high
Take Profit: GREEN center-of-gravity line
These rules create disciplined trading setups without the need for complicated indicators.
Best Timeframes for Using the Indicator
The Center of Gravity V3 works smoothly on:
Intraday charts (M15, M30, H1)
Higher timeframes (H4, Daily, Weekly, Monthly)
Pro tip:
Use higher timeframe zones for trend direction and lower timeframe signals for precise entries. This multi-timeframe approach increases accuracy and reduces false signals.
Why Traders Prefer the Center of Gravity V3 Indicator
Simple visual design
Clear BUY/SELL zones
Predictable take-profit targets
Perfect for reversal trading
Free and easy to install
Works with all currency pairs and timeframes
Whether you are a new trader looking for straightforward setups or an experienced trader building a multi-timeframe strategy, this indicator offers a structured method to trade dynamic Support And Resistance levels.
Conclusion
The Center of Gravity V3 Indicator for MT4 is an excellent overbought–oversold trading tool. By identifying extreme price conditions and highlighting reversion targets, it gives traders the confidence to detect bullish and bearish reversals early. Although powerful, traders should always combine the indicator with Price Action or candlestick confirmation to strengthen BUY and SELL signals.
For more free MT4 indicators and trading tools, visit IndicatorForest.com.
FAQ
1 Download
Published:
Nov 27, 2025 21:51 PM
Category: