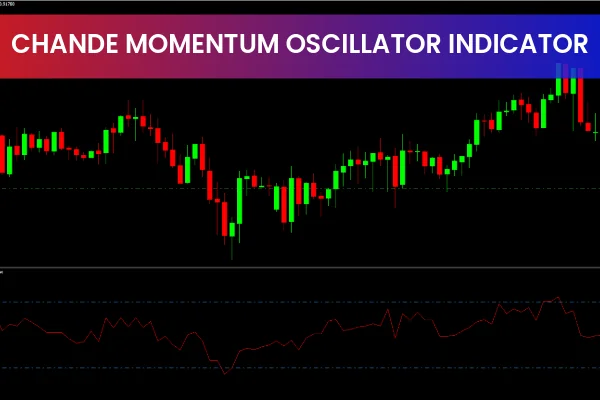
The Chande Momentum Oscillator (CMO) is a technical indicator created by Tushar Chande and introduced in his book Beyond Technical Analysis. Unlike many other oscillators, the CMO measures momentum on both up and down days without smoothing the data, making it extremely responsive to short-term price behavior. This sensitivity allows traders to detect strong momentum shifts earlier than with smoothed indicators.
The core purpose of the CMO is simple: identify strong momentum and trade in its direction. Whether you are trading forex, stocks, crypto, indices, or commodities, the Chande Momentum Oscillator can be applied across multiple markets and timeframes.
How to Read the Chande Momentum Oscillator
The CMO oscillates between +100 and -100. Understanding these levels is key to interpreting momentum strength:
Above +50 → Overbought zone
Below -50 → Oversold zone
Near 0 → Weak momentum / ranging market
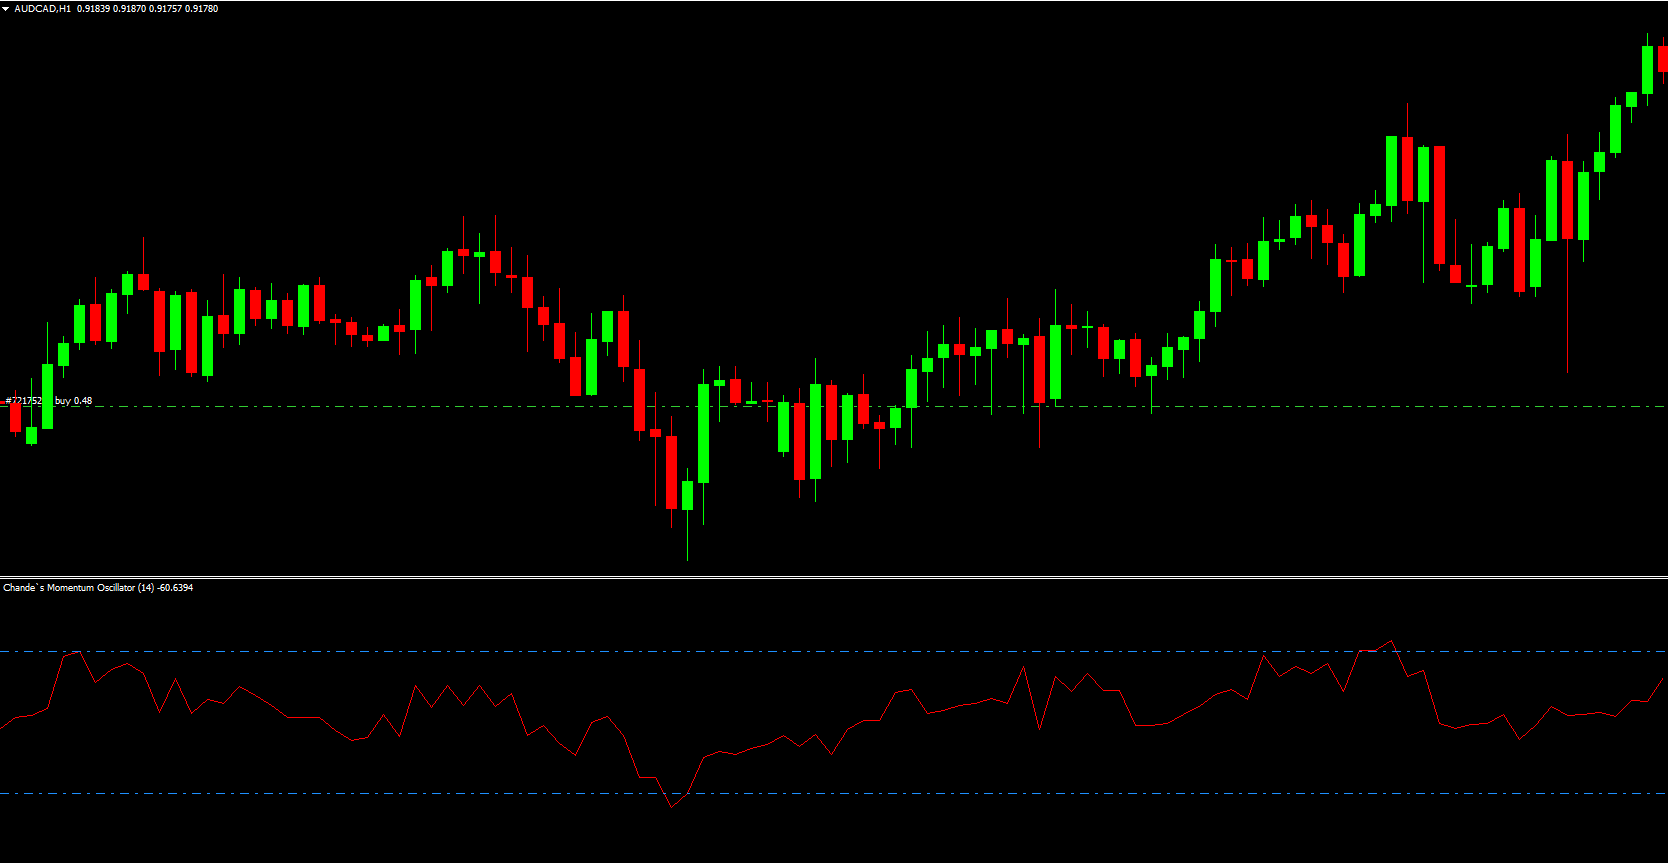
When the CMO rises above the zero line during an uptrend, it signals strengthening bullish momentum. Conversely, when the indicator drops below the zero line during a downtrend, bearish momentum is building.
One advantage of the CMO is its versatility. It works well across multiple timeframes, but it performs best during trending market conditions, not sideways markets. In a range, the indicator tends to produce false signals because momentum fluctuates without clear direction.
How to Use the Chande Momentum Oscillator in Trading
Interpreting Momentum Strength
To use the CMO effectively:
Above 0 → Bullish momentum
Below 0 → Bearish momentum
+50 to +100 → Strong overbought zone (possible reversal)
–50 to –100 → Strong oversold zone (possible reversal)
The closer the indicator moves toward +100 or –100, the stronger the momentum. When the CMO hovers around the zero line, the market is likely consolidating, making it wise to stay out.
Combining CMO With a Moving Average
A popular strategy involves applying a moving average (MA) directly on the CMO indicator window:
Bullish signal → CMO crosses above its MA
Bearish signal → CMO crosses below its MA
This filtering method helps confirm whether momentum is accelerating or fading.
Example Trading Setup
Imagine analyzing GBP/JPY. Price rallies into a previous support-turned-resistance area, while the CMO spikes into the overbought zone above +50. This alignment suggests fading bullish momentum. If the CMO begins to decline and crosses below its MA, a potential short entry becomes valid.
This example illustrates how closely the CMO mirrors price swings and helps anticipate reversals after momentum exhausts.
Advantages of Using the Chande Momentum Oscillator
It reacts faster than traditional smoothed oscillators
Works well in trending markets
Provides clear overbought and oversold readings
Helps identify strong continuation signals
Can be combined with other tools for improved confirmation
Traders often pair CMO with RSI, MACD, or stochastic oscillator for more robust momentum analysis.
Conclusion
The Chande Momentum Oscillator CMO is a powerful Momentum Indicator designed to reveal the strength of price movement without smoothing. When the CMO rises above zero, momentum supports bullish continuation; when it drops below zero, bearish pressure increases. Overbought and oversold levels (+50 and –50) help identify possible reversals.
For the best results, combine the CMO with other momentum tools or a moving average overlay to confirm signals. To enhance your trading skills and get high-quality indicators, visit IndicatorForest.com and explore a wide selection of free and premium trading tools.
FAQ
2 Downloads
Published:
Dec 06, 2025 02:38 AM
Category: