Mastering Structural Highs and Lows: The Chaos Semafor MOD Indicator MT4
Navigating live currency markets requires an objective method for identifying valid swing points. Because financial assets move in nested, multi-tiered waves, retail traders frequently mistake minor intraday retracements for major trend reversals. This temporal confusion leads to poor entry timing and premature stop-outs. The Chaos Semafor MOD Indicator MT4 solves this structural dilemma. Grounded in advanced price-action algorithms and fractal geometry, this algorithmic utility processes market noise to map definitive cyclical peaks and troughs directly onto your trading workspace.
Here is an in-depth breakdown of how this modified technical engine operates and how to use its multi-tiered alerts to time the market.
The Algorithmic Engine Behind Chaos Semafor MOD
The underlying logic of the Chaos Semafor MOD indicator is heavily inspired by classic ZigZag mechanics and Bill Williams’ fractal theory. Instead of reacting to single-candle spikes, the indicator tracks historical lookback periods to confirm when an asset has established a statistically significant swing high or swing low.
The term "Semafor" refers to its visual signaling architecture. As price patterns unfold, the algorithm continuously recalculates mathematical boundaries. When a specific nesting sequence is finalized—proving that buying or selling exhaustion has occurred over a given period—the indicator prints a structural marker. The "MOD" variation advances this classic layout by optimizing the mathematical calculations, drastically reducing calculation lag and organizing structural levels into an intuitive, color-coded hierarchy.
Analyzing the Visual Signals on Intraday Terminals
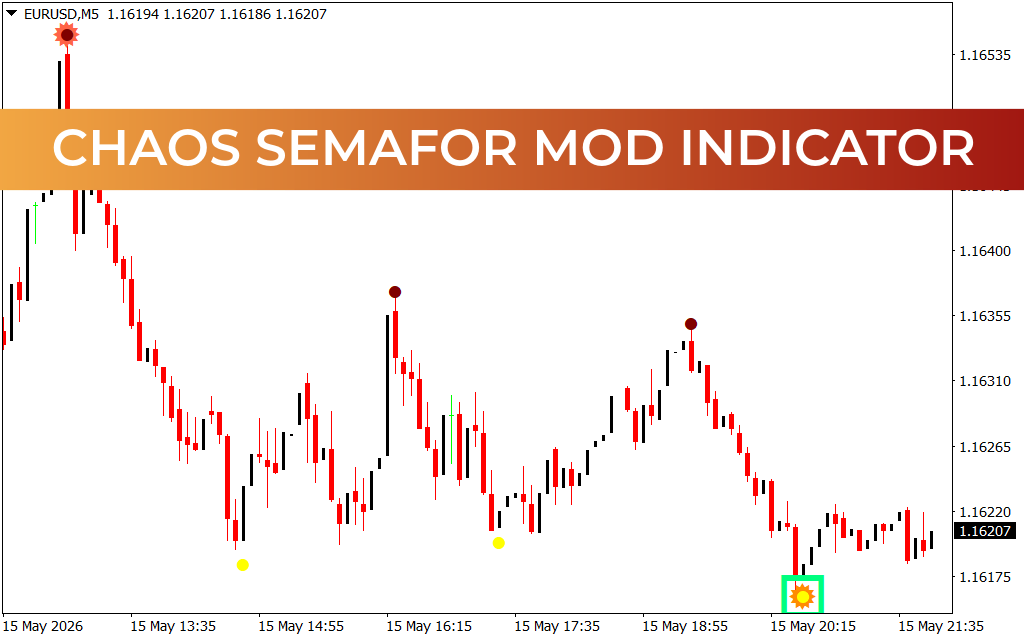
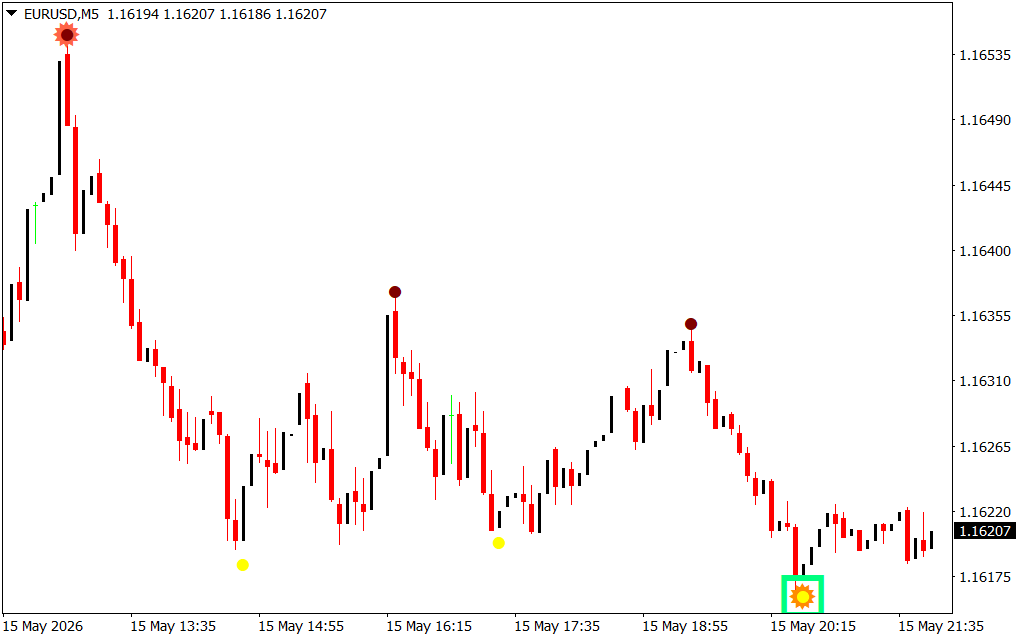
As demonstrated on the EUR/USD 5-minute workspace, the indicator places clean, distinct visual symbols directly above and below critical candlestick pivots:
- The Primary Reversal Suns (Orange Exploded Icons): These major icons represent the highest order of structural exhaustion. When a bright orange sun locks in at an absolute peak—such as the prominent swing high marked on the chart—it warns traders that macro-distribution is complete and a deep markdown phase is imminent.
- The Intermediary Swing Points (Dark Red Dots): Plotted at the crest of minor intraday rallies, these secondary dots map localized supply zones. They highlight key areas where counter-trend buyers fail to sustain higher prices, offering excellent structural locations for trend-continuation entries.
- The Minor Retracements (Yellow Dots): These smaller baseline markers flag short-term demand floors during active liquidations. When price hits a key downside target, a yellow dot stabilizes the candlestick structure, signaling a temporary pause or a short-covering bounce.
Professional Strategies for Execution Terminals
To extract a consistent technical edge from the Chaos Semafor MOD system on your terminal, implement these structured guidelines:
- Wait for Level Locking: Because indicators tracking multi-period extremes evaluate live price data, ensure the current candlestick closes completely to lock the structural dot into position before finalizing your trade execution.
- Trade the Trend Alignment: Use higher-tier symbols to define market direction. If a major orange sun has established an upper boundary, focus exclusively on entering short positions when secondary dark red dots appear on minor pullbacks.
- Strategic Invalidation Marks: Position your defensive stop-loss orders directly behind the primary orange sun icons. Since these icons mark mathematically verified exhaustion zones, a break past these points signals an invalidation of the structural setup.
5 Downloads
Last Update:
May 17, 2026 02:20 AM
Published:
Jan 20, 2026 22:35 PM
Category: